{{ secondMenu.name }}


Introduction
SCP allows you to view the monitoring data of VMs, nodes, and elastic IP addresses in panels.
Monitoring metrics are performance parameters of nodes and VMs under monitoring, including:
(1) Node: CPU usage (%) and CPU usage (Hz).
(2) VM: CPU wait time, CPU limit exceeded time, disk IO latency, and disk partition usage.
Precautions
You can create up to 50 panels on the Monitoring Dashboard page.
Prerequisites
None.
Procedure
1. Log in to SCP as an administrator and go to Resources > Monitor Center > Monitoring Dashboard. If this is the first time you access this page, no panel exists by default. Click New Panel to manually add panels.

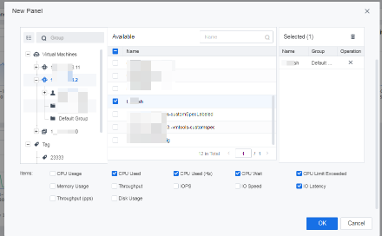
2. Select the target VM and the following monitoring metrics: CPU Used, CPU Used (Hz), CPU Wait, CPU Limit Exceeded, and IO Latency. Then, click OK.

You can create up to 50 panels on the Monitoring Dashboard page.
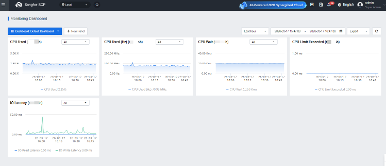
3. After the panels are added, they are displayed on the page.
4. You can select VM, node, elastic IP address, or shared bandwidth as the object type.
The figure below shows the VM metrics that you can select.
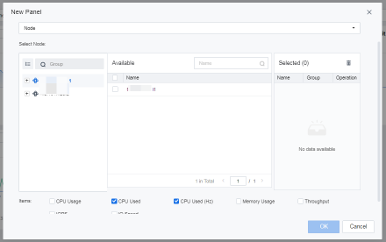
The figure below shows the node metrics that you can select.
The figure below shows the elastic IP address metrics that you can select.
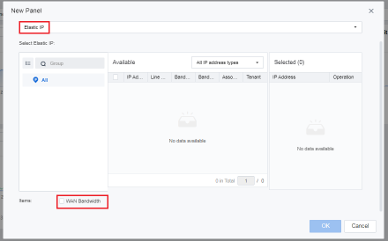
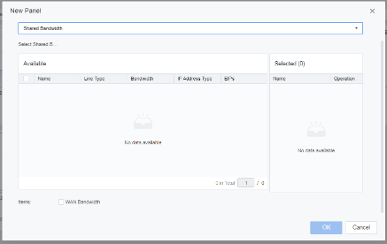
The figure below shows the elastic IP address or shared bandwidth metrics that you can select.


 {{ $t('index.defaultHeader.chromeBrowserTip') }}