{{ secondMenu.name }}


Introduction
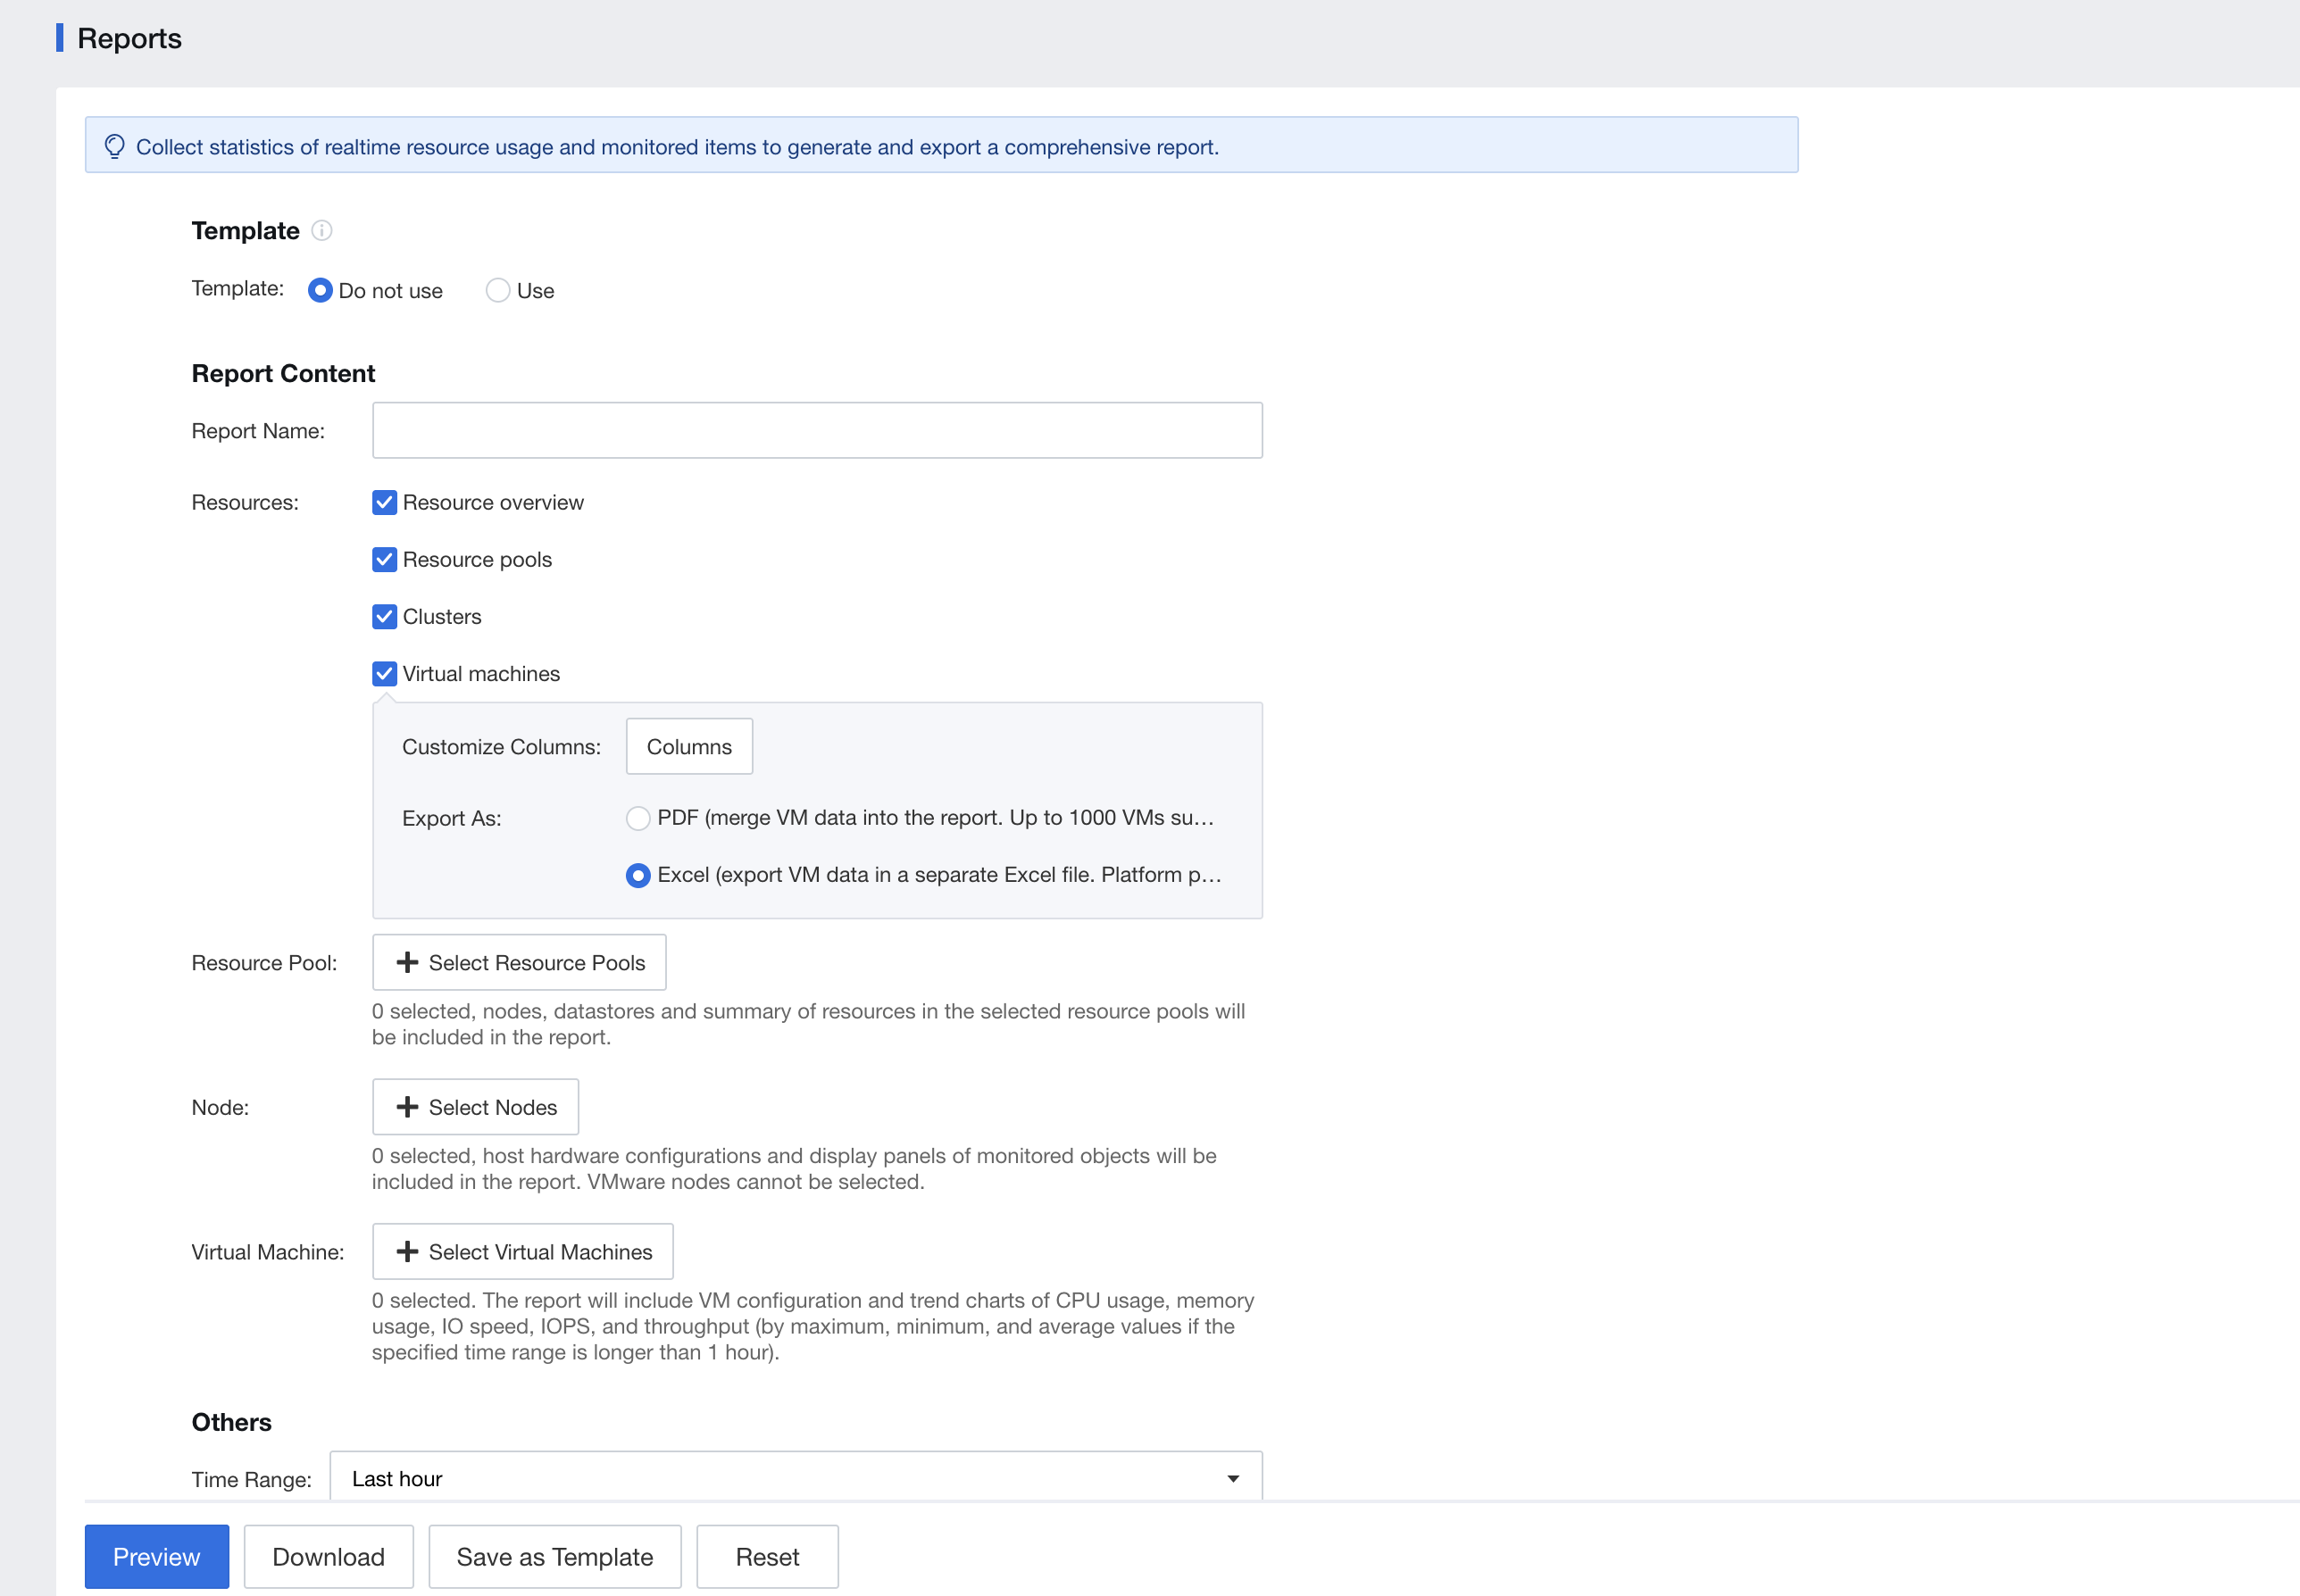
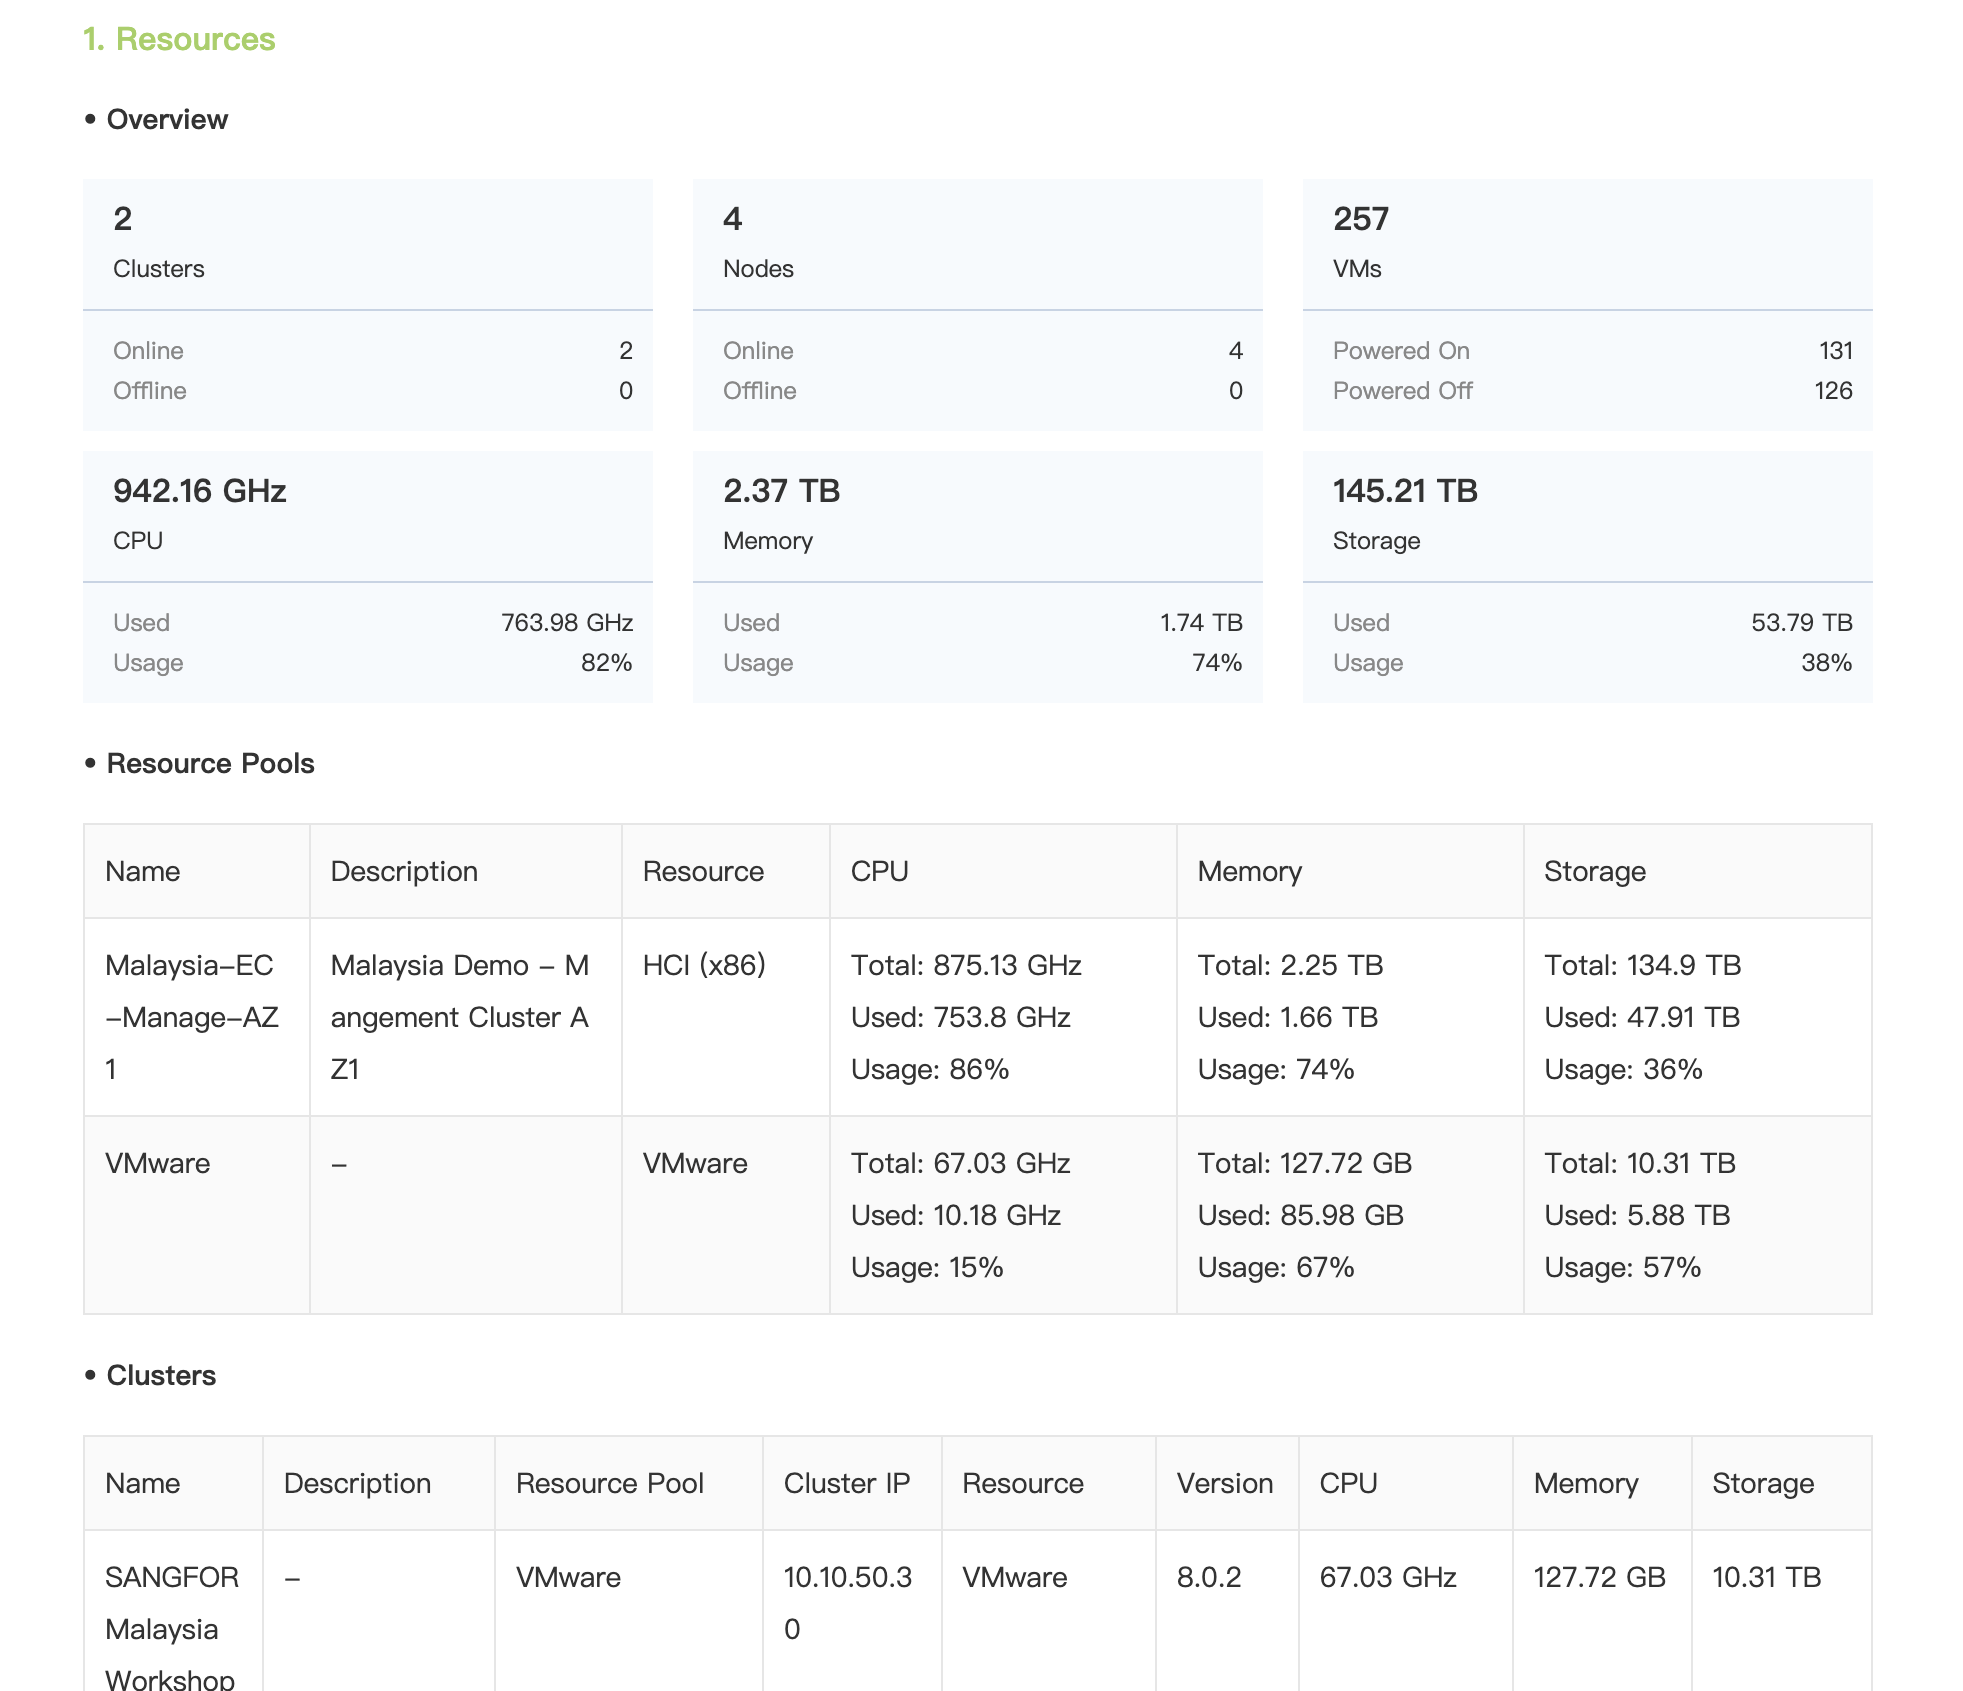
SCP can collect the real-time status of cloud platform resources and display the information in panels. In addition, it can aggregate resource configuration information and generate O&M reports. You can export the reports to view the following information:
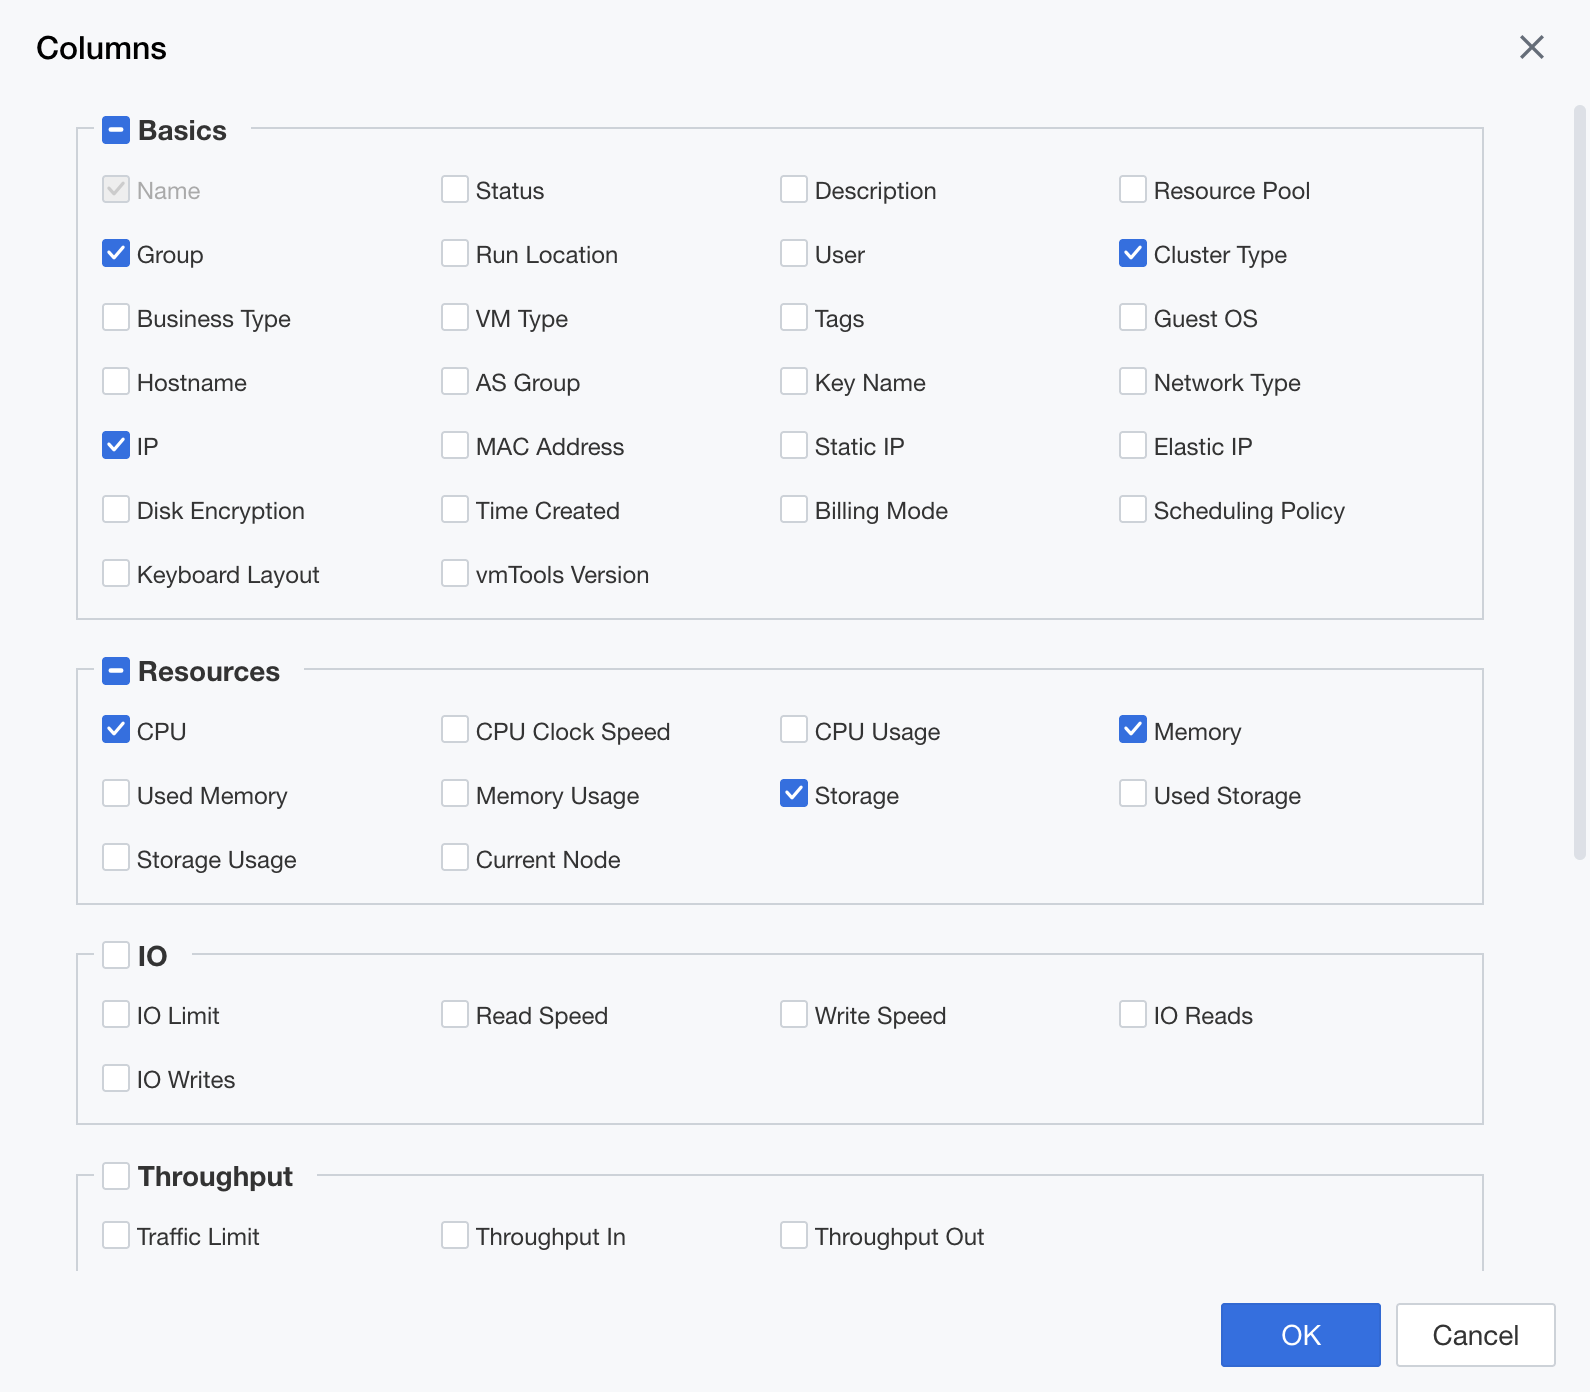
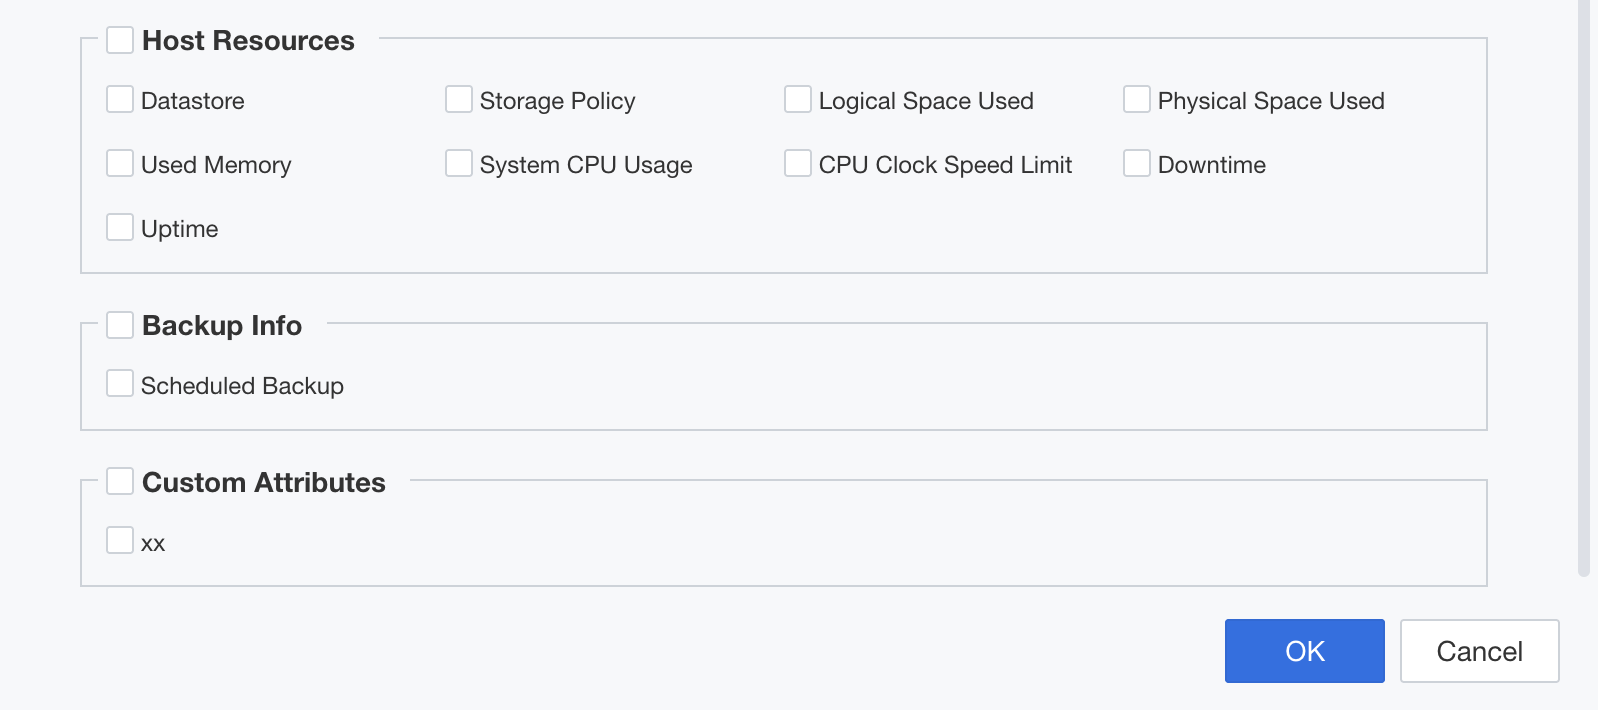
VM status, hostname, service type, AS group, private key name, elastic IP address, owner, VM description, OS, tag, real IP address, disk encryption, scheduling policy, run location, CPU frequency, used memory, used storage, current node, VM downtime, datastore, storage policy, memory actually used, physical space actually used, logical space actually used, uptime, scheduled backup status, and custom attributes.
Precautions
None.
Prerequisites
None.
Procedure

 {{ $t('index.defaultHeader.chromeBrowserTip') }}