{{ secondMenu.name }}


Introduction
SCP allows you to view the monitoring data of VMs, nodes, and elastic IP addresses in panels.
Precautions
You can create up to 50 panels on the monitoring overview page.
Prerequisites
None.
Procedure
![]()
![]()
You can create up to 50 panels on the monitoring overview page.
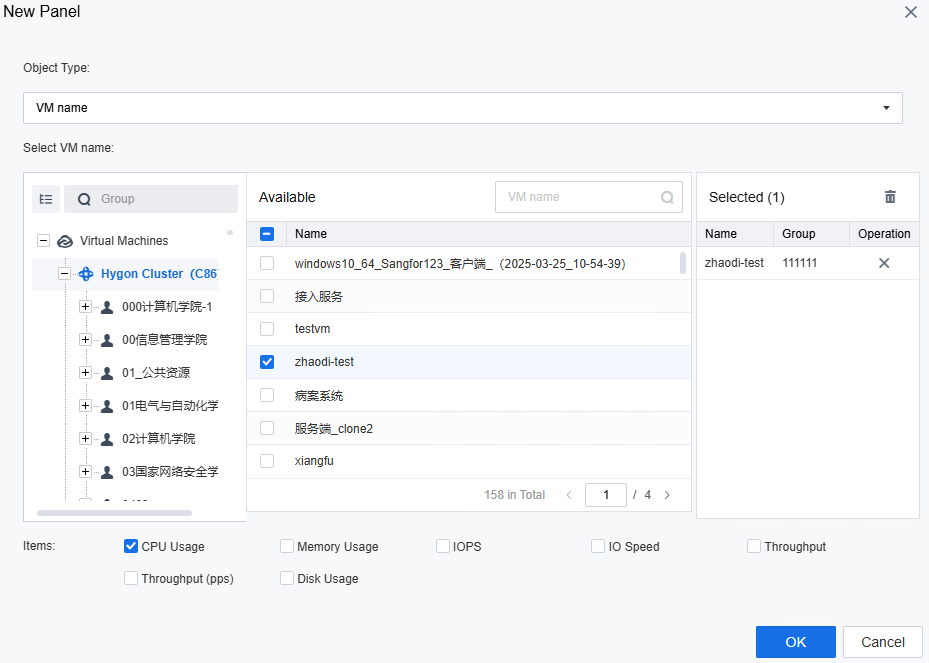
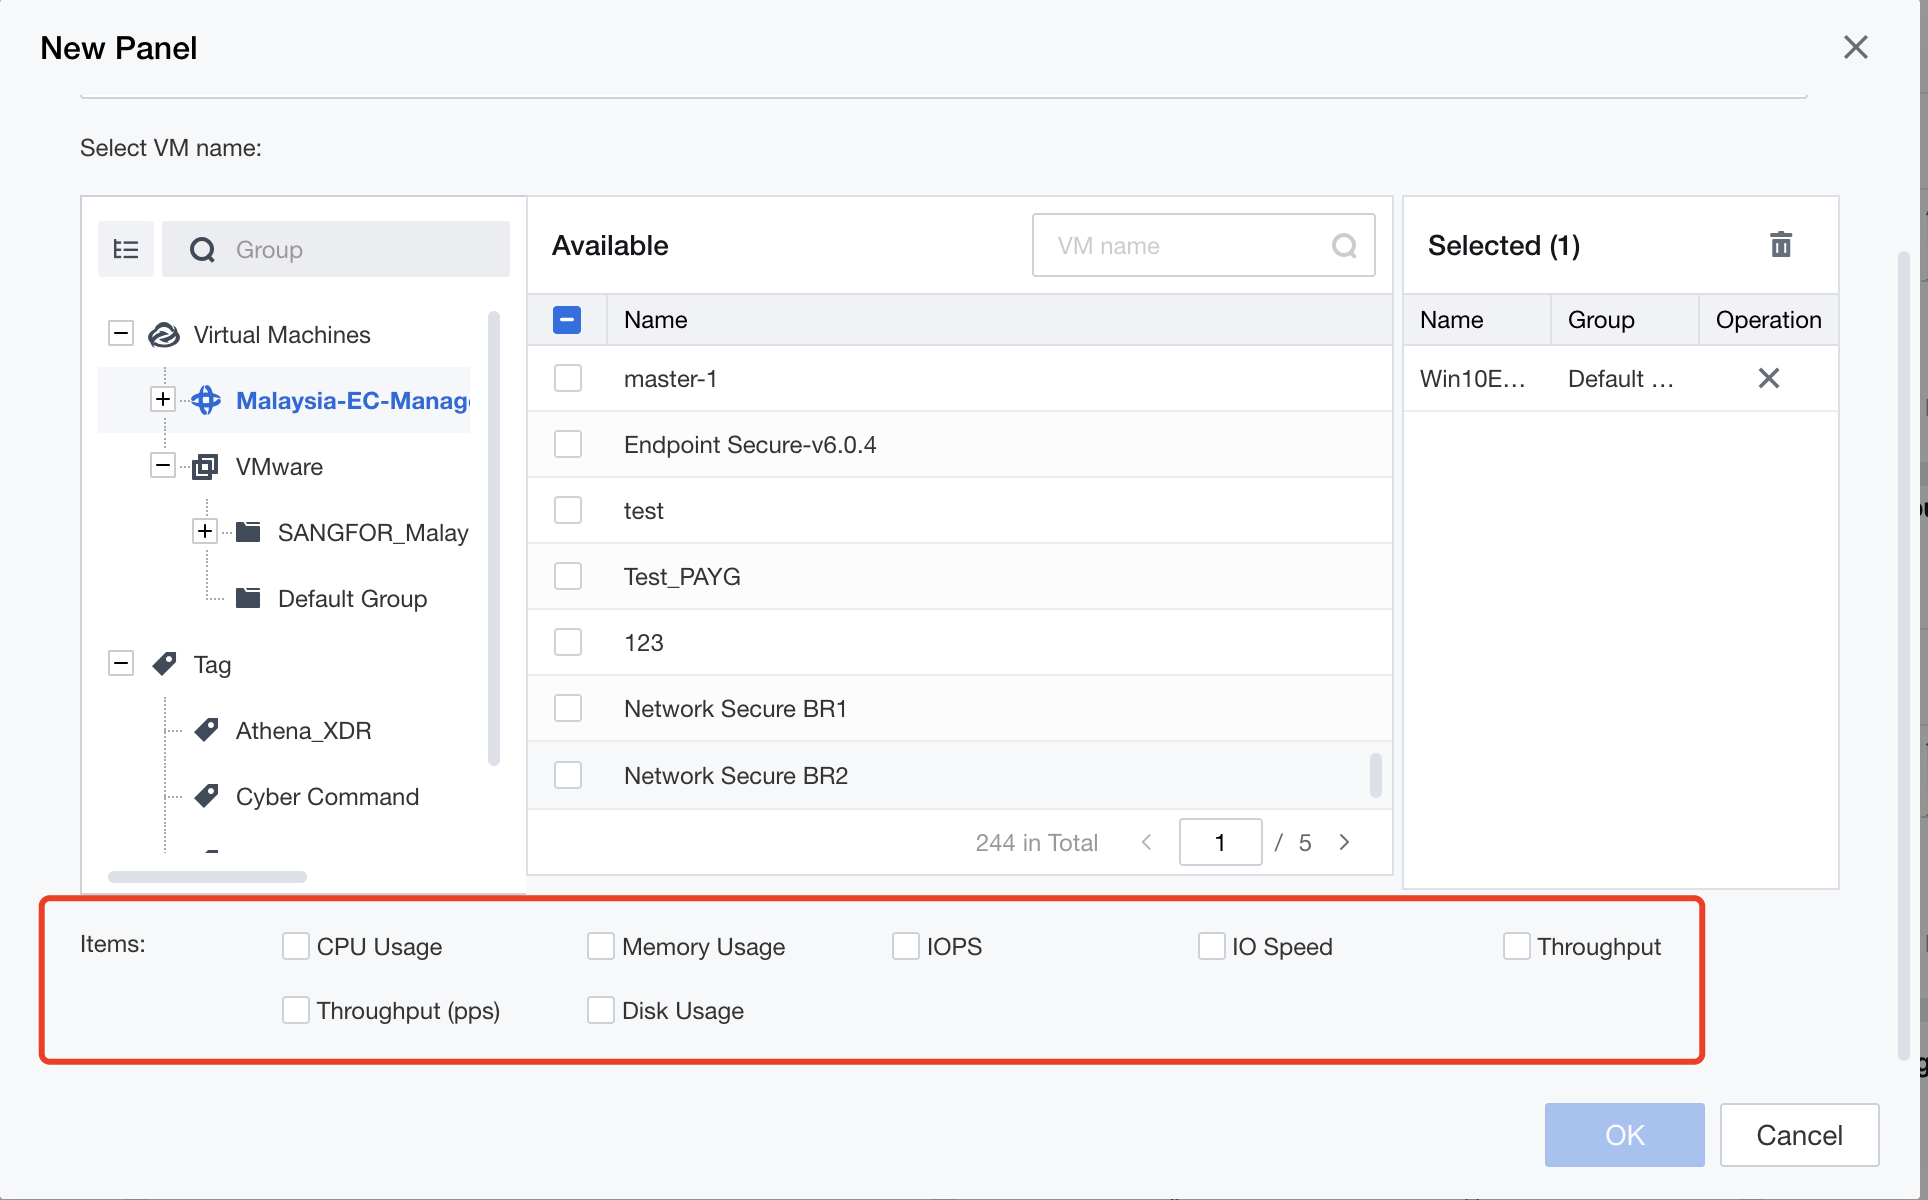
The figure below shows the VM metrics that you can select.
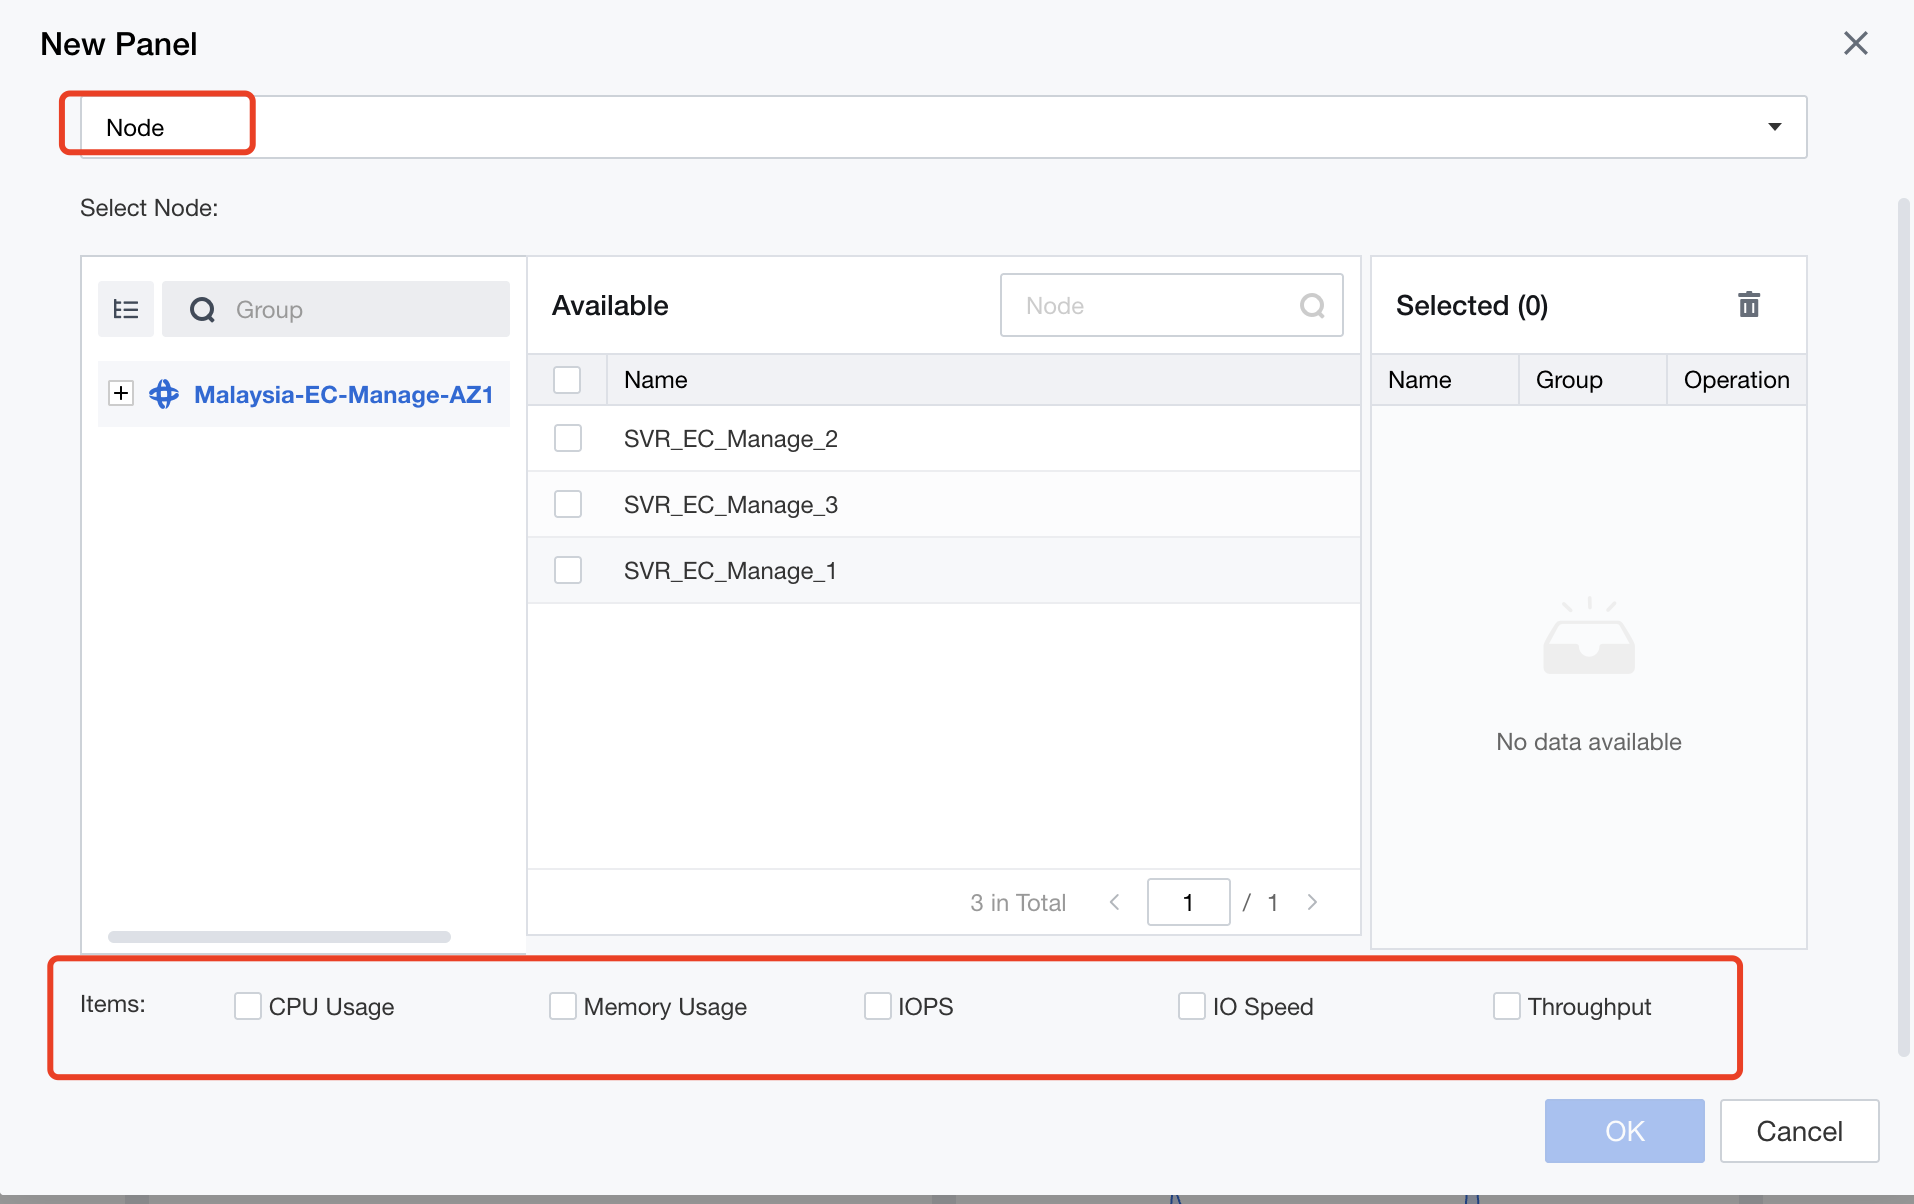
The figure below shows the node metrics that you can select.
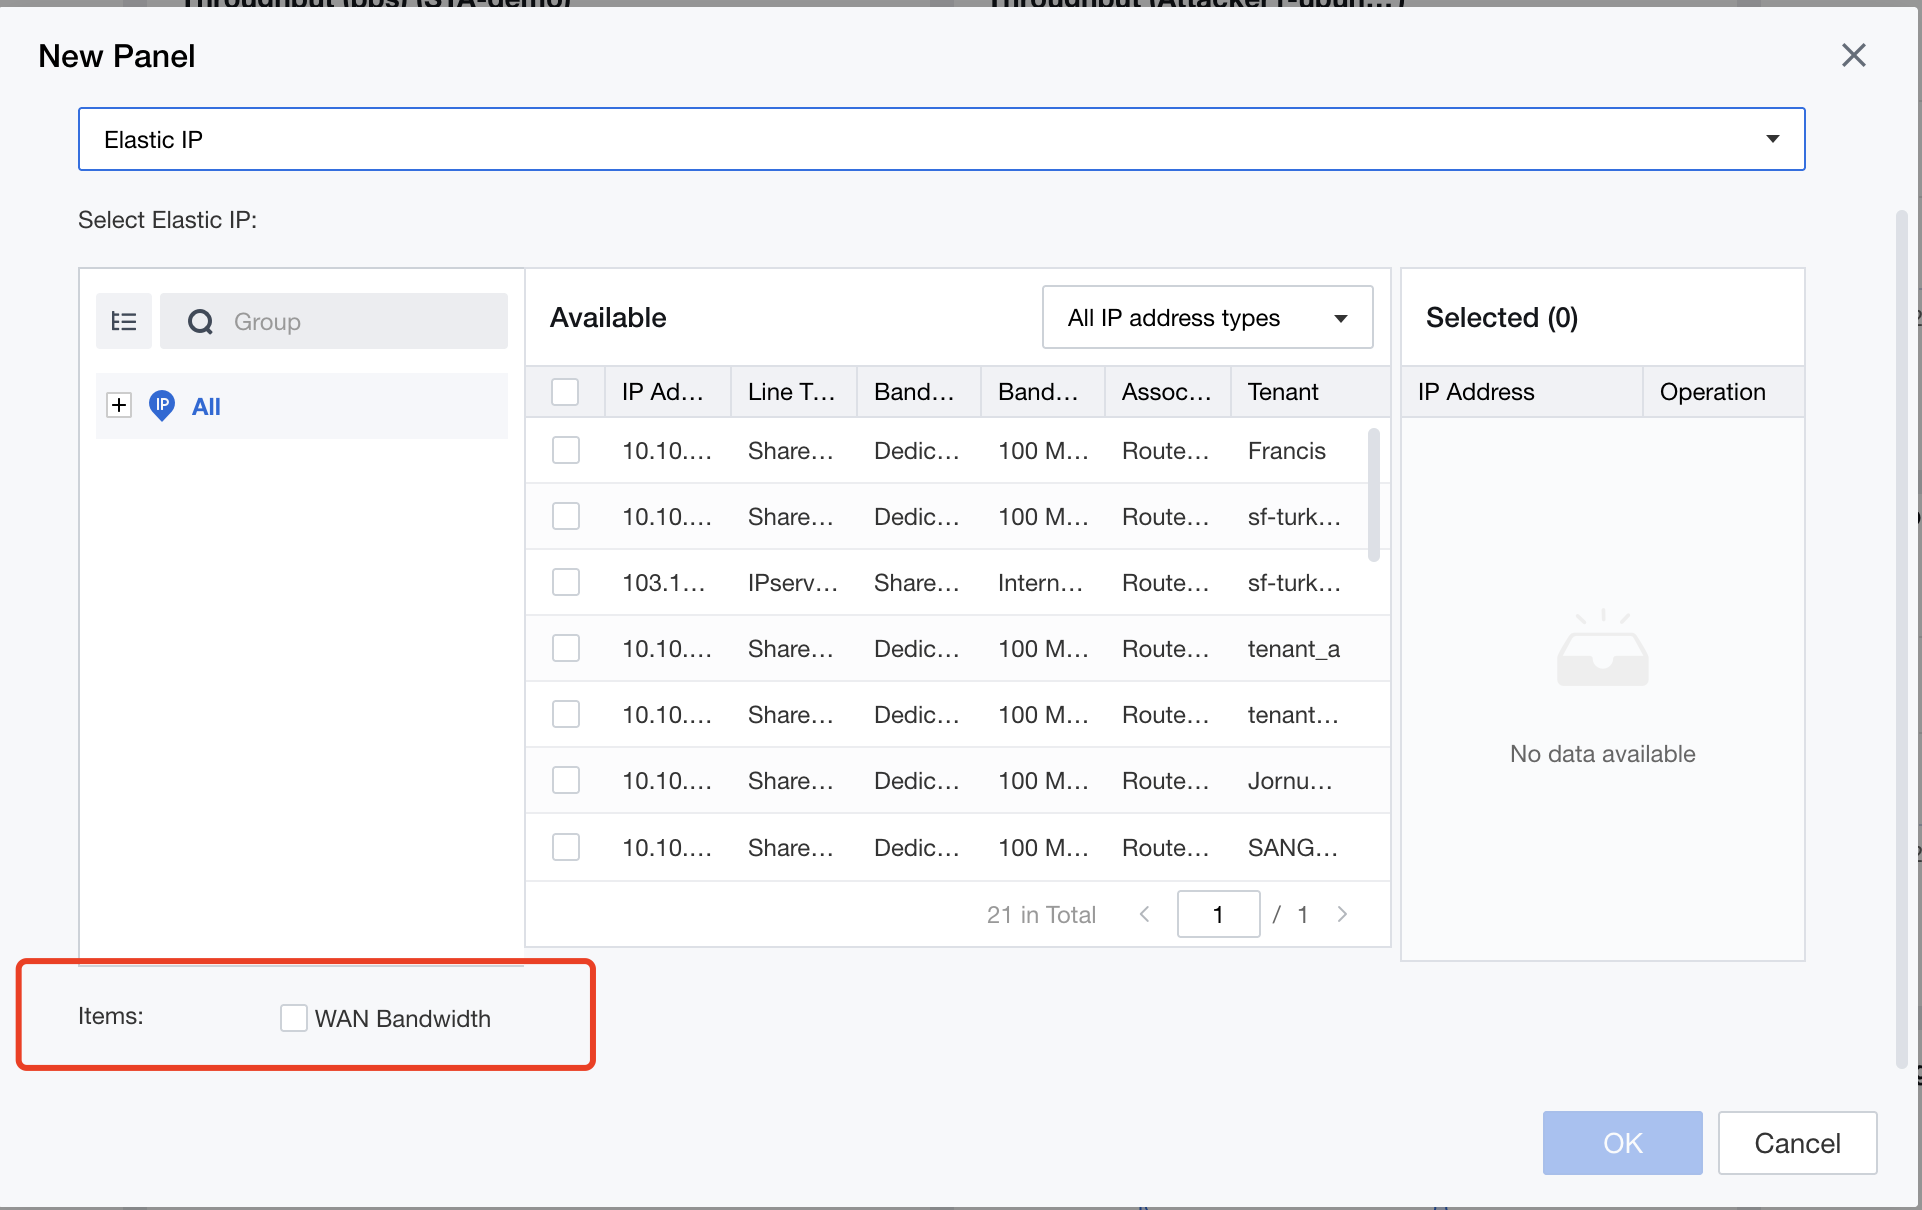
The figure below shows the elastic IP address metrics that you can select.

 {{ $t('index.defaultHeader.chromeBrowserTip') }}