{{ secondMenu.name }}


On the Summary page, it displays the following sections, Status, Storage Usage, Realtime Status, Performance of Virtual Storage, Unread Alarms and Task Status. 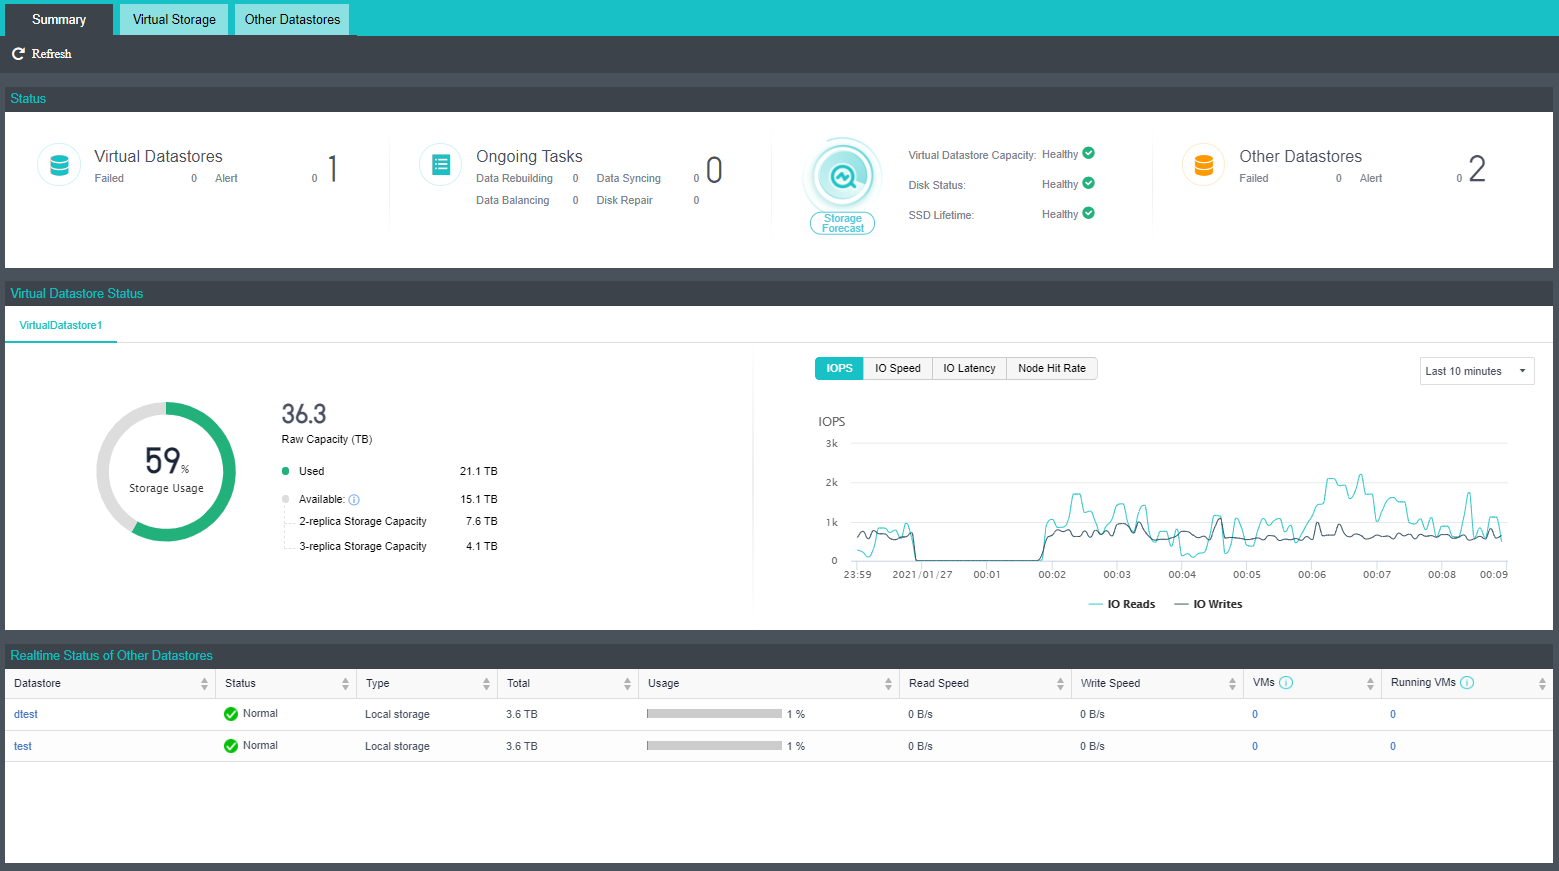
Status: This section displays the number of virtual datastores and other datastores, the status of those datastores, the number of unread alarms, and the number of ongoing tasks, as shown below: 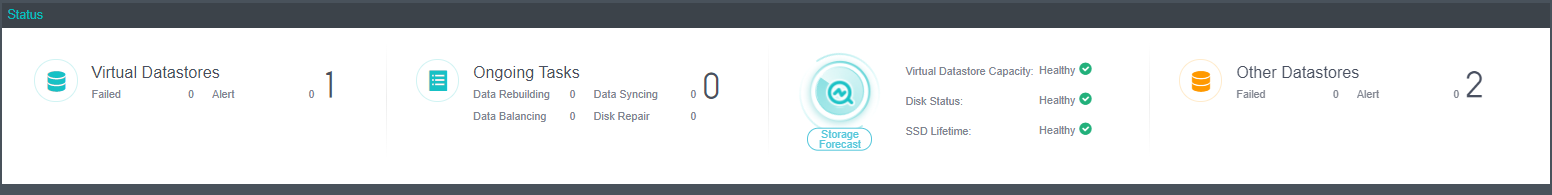
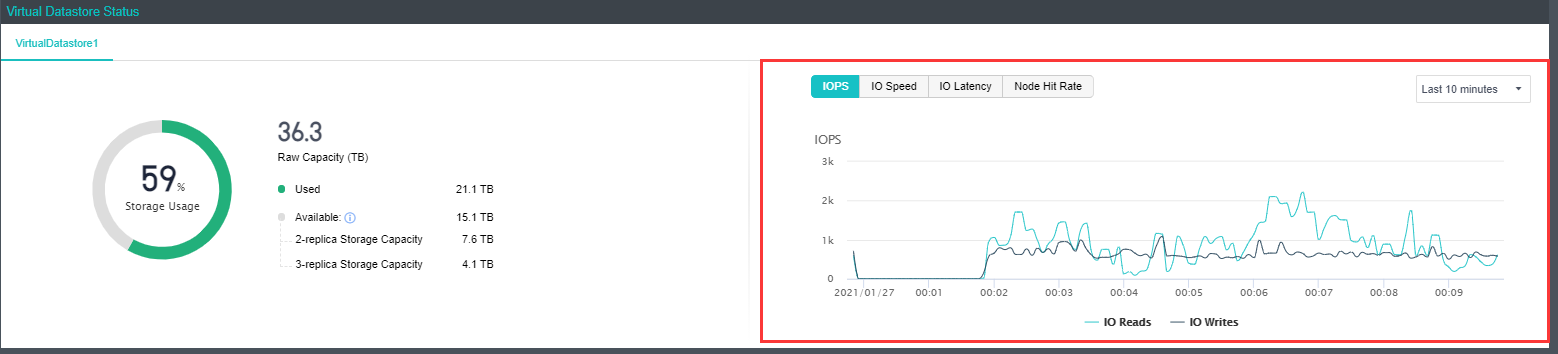
Virtual Storage Usage: This section displays the storage usage of the entire HCI, including the total number of storage, the quantity already used, and the unused quantity. as shown below:
This section also displays IOPS, IO speed, IO latency, storage usage, cache hit rate, and node hit rate of the specified virtual datastore in different period, as shown below. On the following graph, you may view IOPS, IO Throughput, IO Latency, and Node Hit Rate.
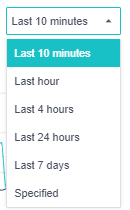
To specify Period, you can choose Last 10 minutes, Last hour, Last 4 hours, Last 24 hours, Last 7 days, or Specified to customize a new period, as shown below: 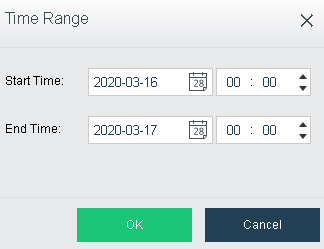
IOPS: Indicates virtual storage input/output operations per second, which represents IO performance of virtual storage.
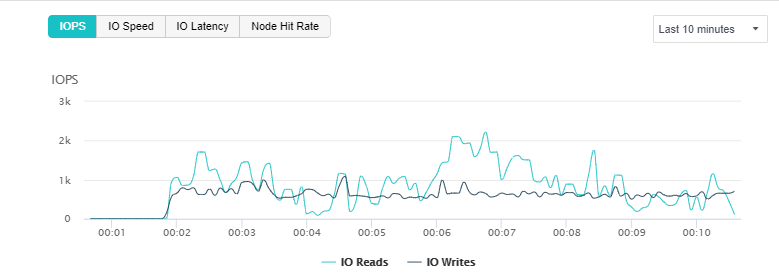
IO Speed: Indicates bytes read or written by virtual storage per second, which represents IO throughput of virtual storage. 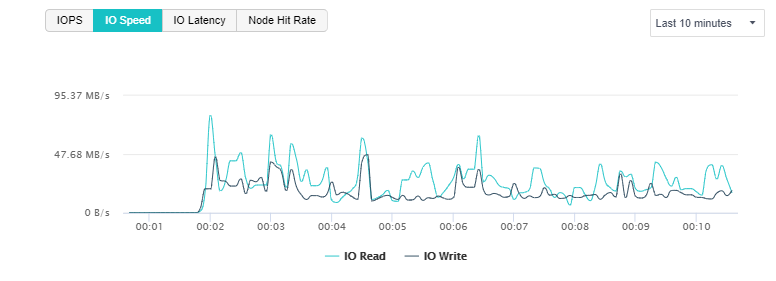
IO Latency: Indicates how long it takes for virtual storage to perform each write/read operation. Through IO latency trending graph, you may know storage IO load. If IO latency increases, it indicates that IO request is in queue and IO performance becomes poorer. Generally, it indicates that IO load is low if the average IO latency is less than 30ms and that IO load is normal if the average IO latency is less than 60ms. 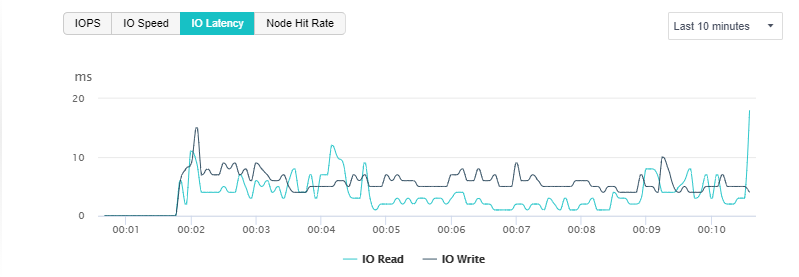
Bar graph of Node Hit Rate shows the average hit rate of different nodes. 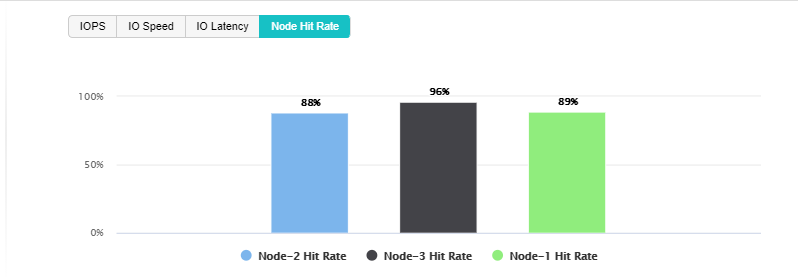
Realtime Status of Other Storage: This section displays the name of datastore, storage type, datastore capacity and usage, read and write speed, the number of virtual machines stored on the datastore, and the number of running virtual machines, as shown below: 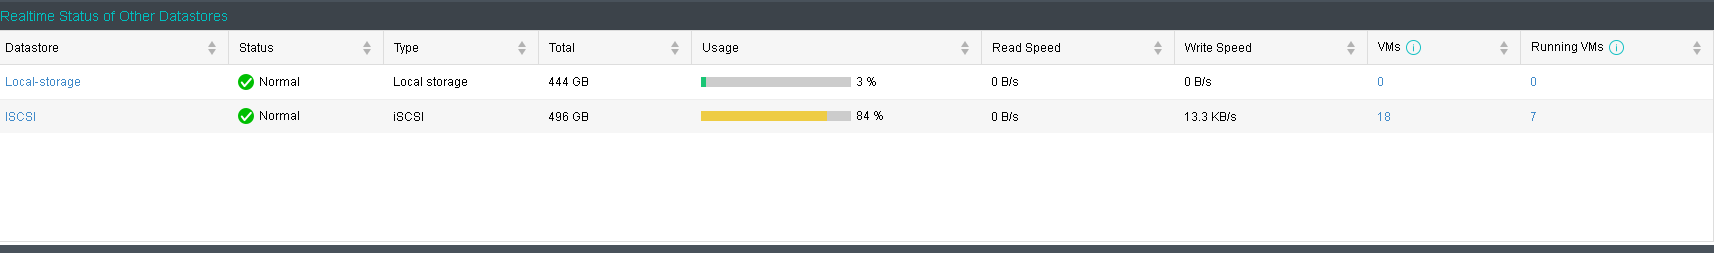
Unread Alerts: This section displays unread alarms, and you can click All Alarms to view those alarms in details.
Task Status: This section displays the ongoing data sync and data balancing tasks, and you can click All Tasks to view details. 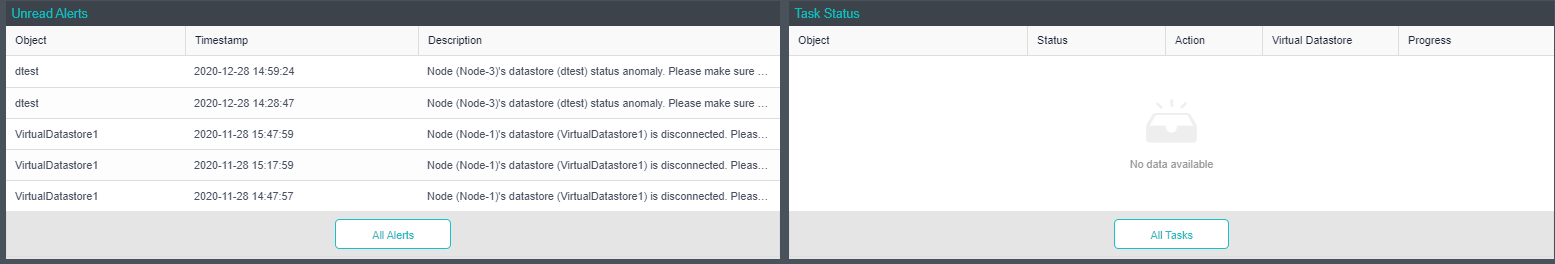

 {{ $t('index.defaultHeader.chromeBrowserTip') }}