{{ secondMenu.name }}


Feature Description:
Sangfor SCP platform can monitor virtual machines, physical nodes, and elastic IPs. By adding monitoring charts, the monitoring information can be displayed as charts.
Precautions:
None.
Prerequisite
None.
Steps:
Step 1.Login to the SCP and navigate to Resources > Monitor Center > Monitoring Dashboard. There will be no monitoring panel by default. You need to add it manually by clicking New Panel. 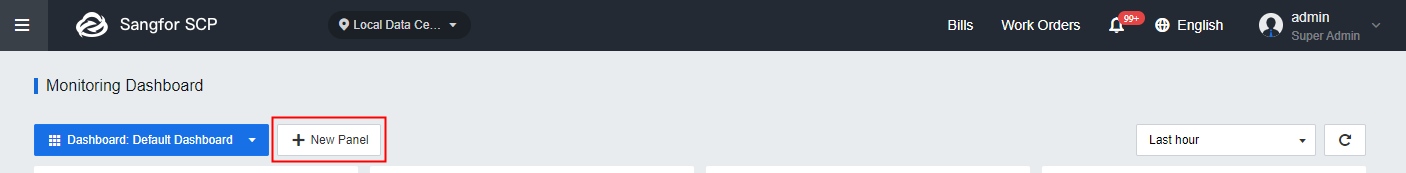
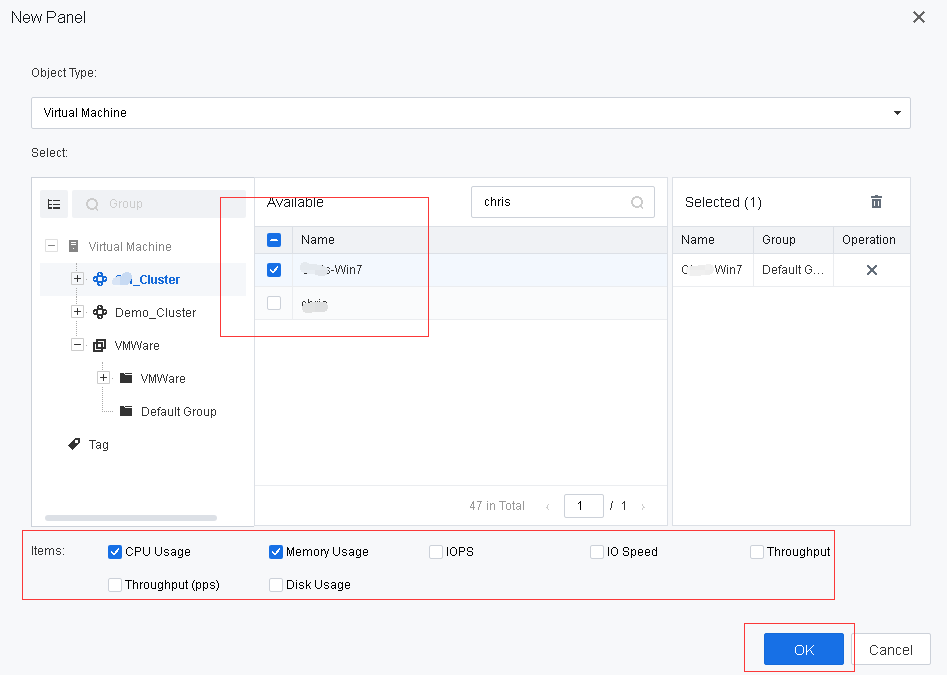
Step 2.Select the virtual machines and Items that need to be monitored, then click OK to add.
![]()
There is currently 50 monitoring panel that can be created on the monitoring dashboard page.
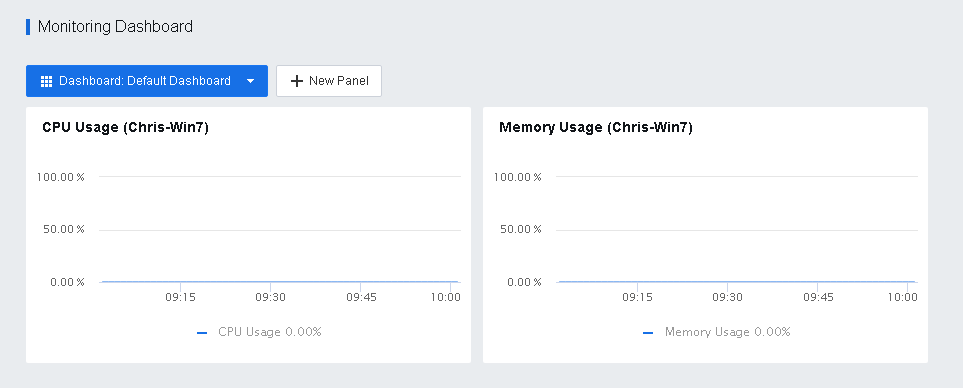
Step 3.You may see the virtual machine dashboard after adding the panel.

 {{ $t('index.defaultHeader.chromeBrowserTip') }}