{{ secondMenu.name }}


Application Scenario
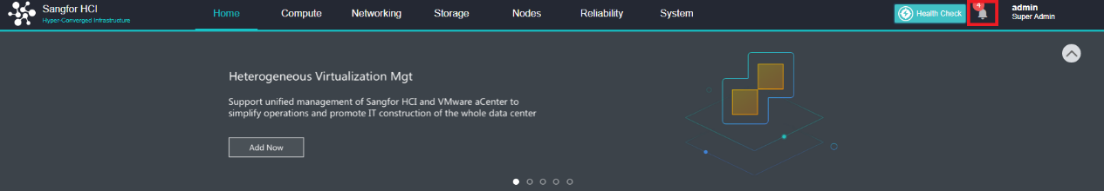
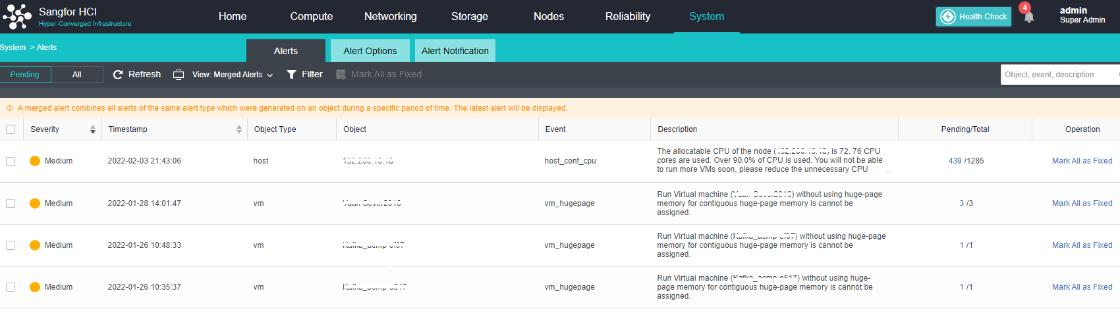
It is suitable for the operation, maintenance, and monitoring scenarios of the HCI platform. The administrator can view the platform's alert information on the HCI console's home page and solve the problem in time according to the alert information.
Steps
| Alert module |
Monitoring item |
Common alarm |
Emergency alert |
| Node |
Host swap partition occupancy |
For 10 minutes, the swap partition occupies more than 10% |
|
| Host CPU usage |
CPU usage exceeds 90% for 10 minutes |
|
|
| host CPU temperature |
Abnormal temperature for over 10 minutes. |
|
|
| host CPU frequency |
Host CPU throttling |
|
|
| Host memory usage |
Memory usage exceeds 90% for 10 minutes |
|
|
| Memory frequency |
Memory underclock. |
|
|
| Physical network |
Host network port error packet |
The packet error rate exceeds 10% for 10 minutes |
|
| Node interface status |
|
Node interface dropped |
|
| Cluster Node status |
|
Node offline |
|
| Data communication incoming interface (VXLAN) status |
|
The data communication incoming interface (VXLAN) is unavailable. |
|
| Host NIC working status |
|
The host NIC works abnormally for 10 minutes. |
|
| Node NIC traffic status |
|
Host NIC traffic reaches 90% of the upper limit for 10 minutes |
|
| NIC driver firmware compatibility |
|
Incompatible NIC driver firmware |
|
| NIC status |
|
Damaged NIC |
|
| NIC optical module status |
|
NIC optical module is abnormal |
|
| Storage |
Store IO status |
Storage IO busy for 10 minutes |
|
| Backup repository state |
Backup repository IO is busy |
|
|
| Store IO latency status |
Storage IO latency is high for 10 minutes |
|
|
| Store the connection status with the node |
|
The storage is disconnected from the node |
|
| Storage state |
|
Abnormal storage status |
|
| RAID card status |
|
RAID status |
|
| Storage Occupancy Threshold |
|
More than 90% |
|
| Storage Backup Repositories Occupancy Threshold |
|
More than 90% |
|
| Virtual Machine |
virtual machine memory usage |
Memory usage exceeds 90% for 10 minutes |
|
| Virtual machine CPU usage |
CPU usage exceeds 90% for 10 minutes |
|
|
| Virtual machine image file |
|
Corrupted virtual machine image file |
|
| Virtual Machine Backup Status |
|
Virtual machine backup fails |
|
| Virtual machine and external network connectivity |
|
The virtual machine cannot communicate with the external network |
|
| Number of session connections on a single incoming interface of a virtual machine |
|
Lasts for 3 minutes, more than 100000 sessions |
|
| Virtual machine state |
|
Abnormal shutdown or restart of virtual machine |
|
| Virtual network |
Virtual network device CPU usage |
CPU usage exceeds 90% for 10 minutes |
|
| Virtual network device image file |
|
Corrupted virtual network device image file |
|
| Router operating status |
|
Router fails |
|
| Virtual network device ALG usage |
|
ALG usage exceeds 90% for 30 seconds |
|
| Virtual network device and external network connectivity |
|
The virtual network device cannot communicate with the external network |
|
| Cluster |
Reminder of regular inspection frequency |
Once a month |
|
| Licensing status |
|
Licensing expired |
|
| License key status |
|
The license key status is abnormal |
Table 11:Alert Modules

 {{ $t('index.defaultHeader.chromeBrowserTip') }}