Sangfor HCI and aSV provide a unified infrastructure combining compute, storage, networking, and built-in security to simplify deployment, operations, and services.
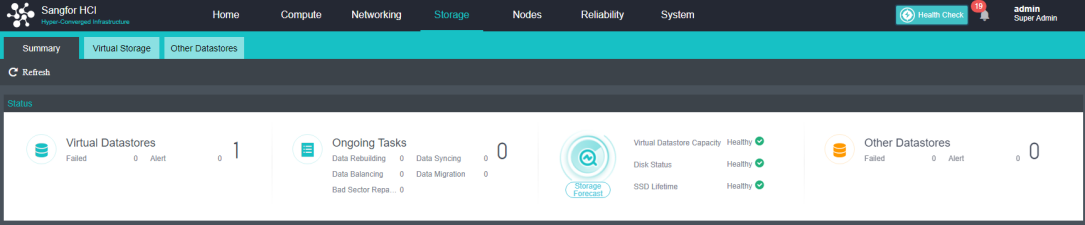
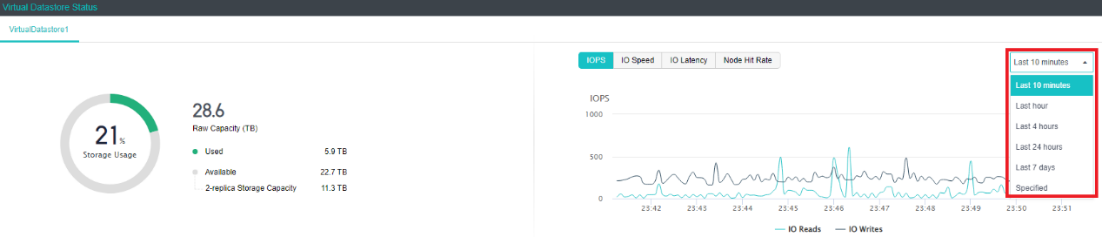
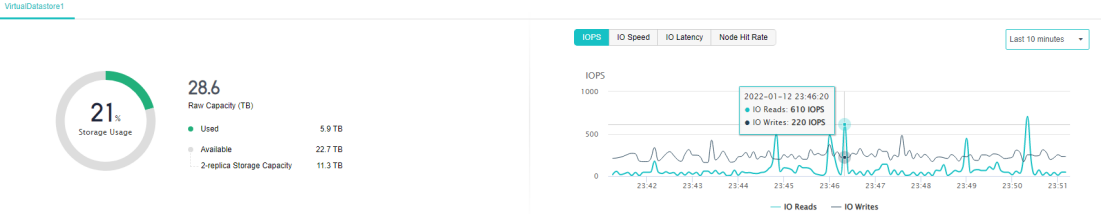
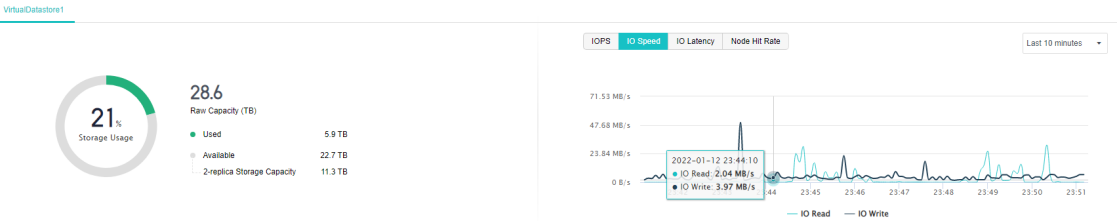
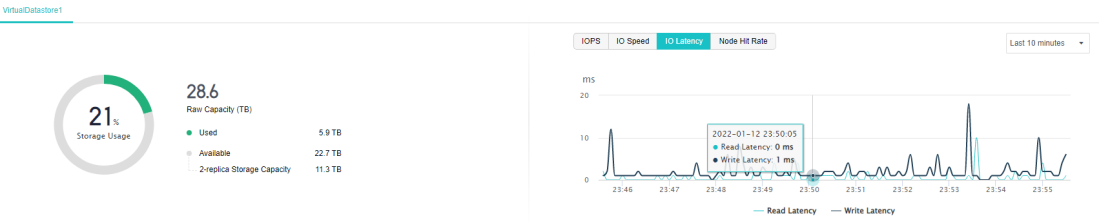
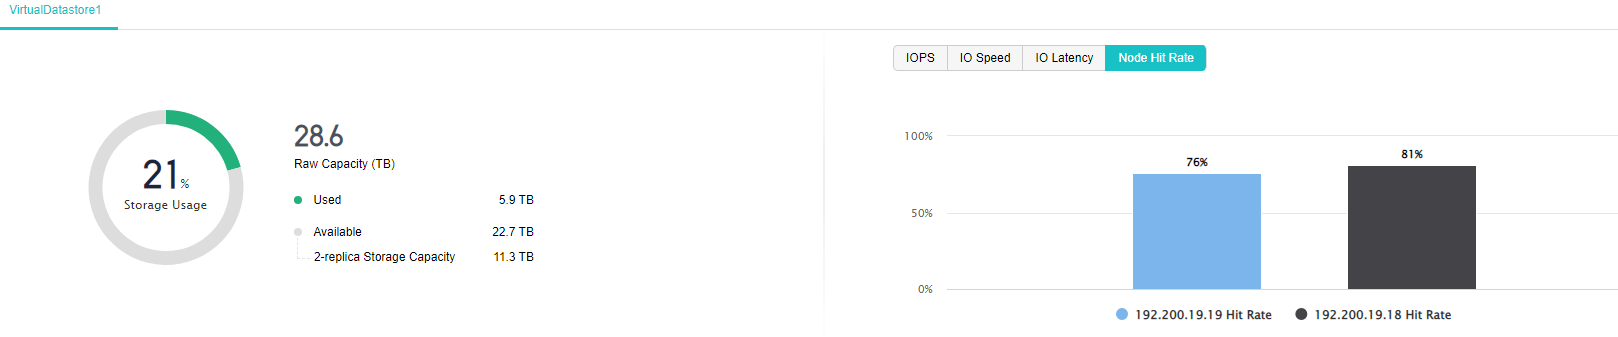
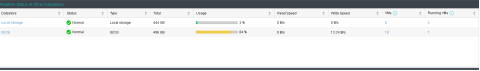
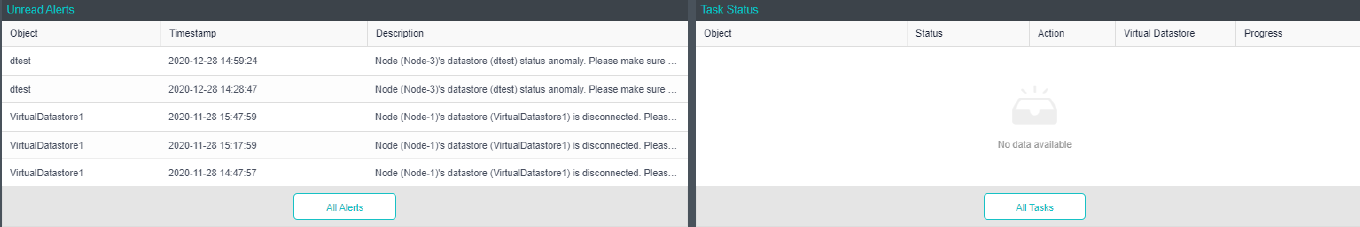
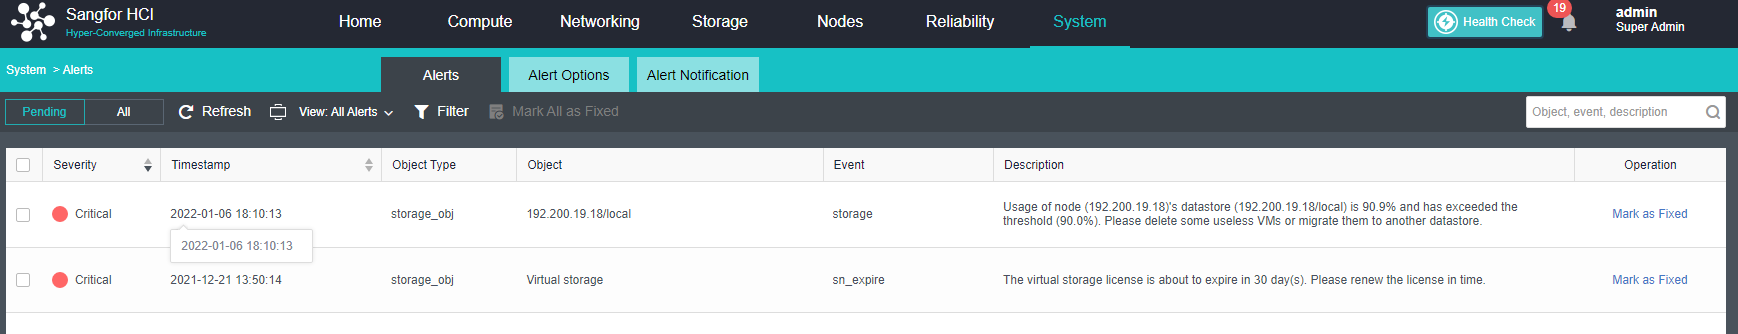
You can view the status, usage, real-time status, performance status, alarm log, and task execution status of all storage by viewing the storage status.
Precautions
None.
Prerequisites
None.
Steps
In Storage, you can view the Summary page. In Status, you can see the running status of all storage. If there is an abnormality, you can directly click on the number on the page to locate the abnormal storage.
In Virtual Datastore Status, you can see the current total capacity, used capacity, and remaining capacity of the virtual storage. Select the corresponding time range to view the IOPS, IO speed, IO latency, and node hit rate in this period.
IOPS shows the number of virtual storage reads and writes per second, corresponding to the industry term IOPS value. It shows the trend of concurrent IO times of virtual storage, reflecting the random IO capability of virtual storage.
IO Speed shows the number of bytes read and written per second of virtual storage, read xxx MB and write xx MB per second, and shows the concurrent IO throughput of virtual storage. The IO speed trend can reflect virtual storage. Sequential IO capability.
IO Latency shows the average time required for each reading and writing of virtual storage. The IO load of the storage can be seen from the IO latency trend. If the IO latency increases, IO requests are already queued. Performance starts to fall short. Usually, the average IO latency is lower than 30ms, which means that the load is very light, and it is normal if it is lower than 60ms.
Node Hit Rate displays the average cache hit rate of the node since it was powered on. The histogram can visually compare the difference in the hit rate of different nodes.
In Realtime Status of Other Storage, you can see the total capacity of other storage, usage, read speed, write speed, the number of virtual machines stored on the storage, and the number of running virtual machines.
In Unread Alerts, you can view HCI alert information, and in Task Status, you can view the tasks currently being executed by the HCI cluster. These two items can be viewed separately from the page.