{{ secondMenu.name }}


You can view logs on the Security Logs, Coordinated Action, Control Logs, Operations Logs, and Admin Logs pages, and manually export and subscribe to reports of risks.
You can query security logs by going to System > Logs > Security Logs. These logs mainly include security-related information, such as anti-malware, vulnerability scan, security compliance check, intrusion detection, micro-segmentation, server protection, USB device control, USB device blocking, and hacktool protection, as shown in the following figure.
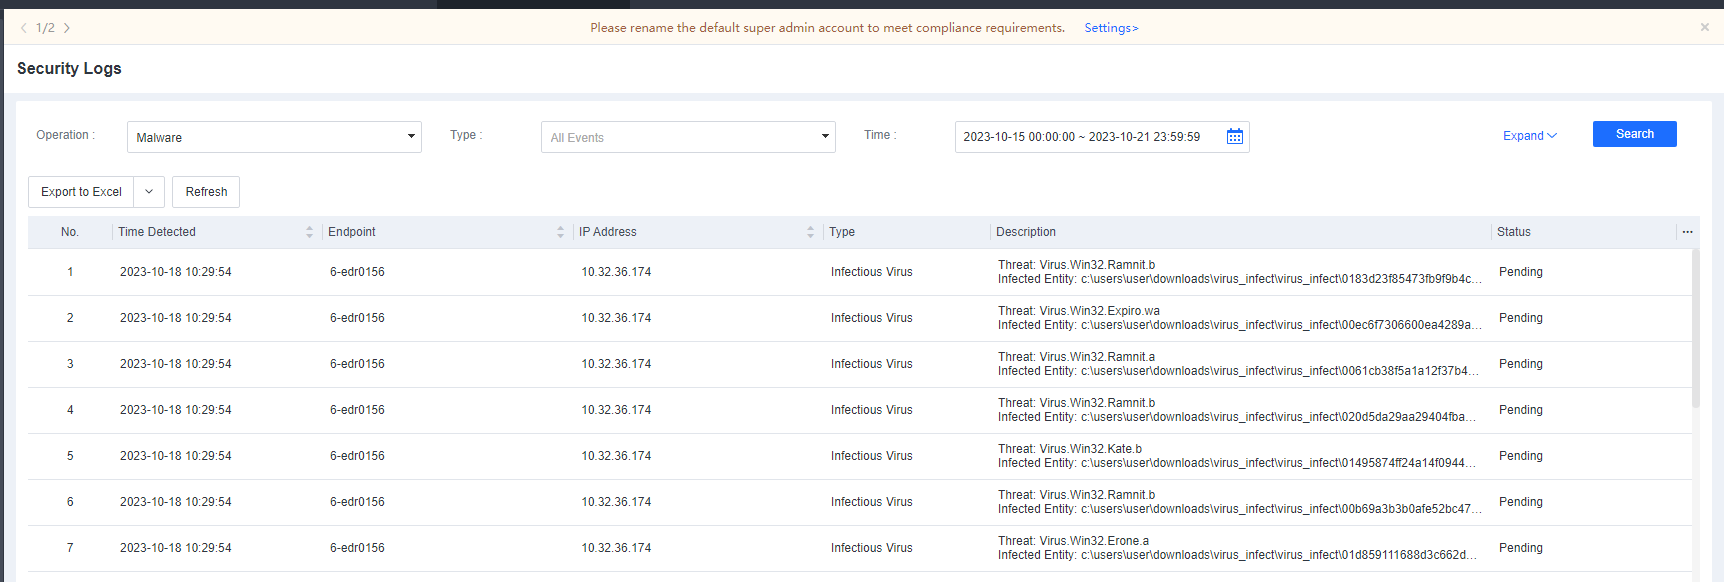
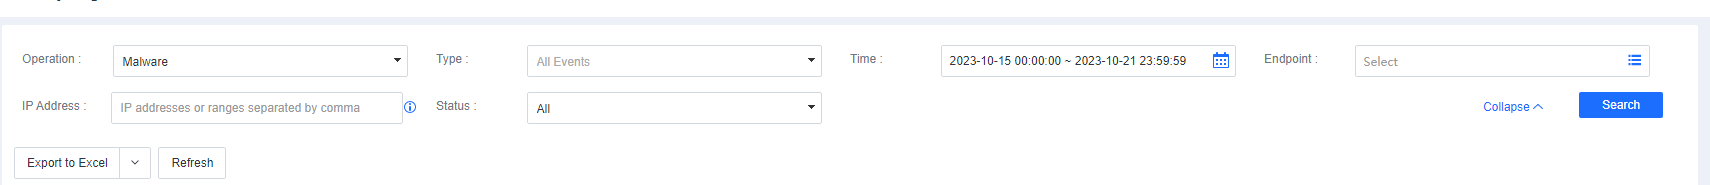
You can first filter these logs by operation and time, and then click Expand to filter logs by endpoint name and IP address. The filtering results can be exported.
On the Coordinated Action page, as shown in the following figure, you can view logs that record the coordinated actions between Athena EPP and other Sangfor products, such as action overview, integration time, device IP address, device type, integration type, and integration description. Athena EPP can be integrated with Athena NGFW, Athena NDR, Athena MDR, Platform-X, and Athena XDR.
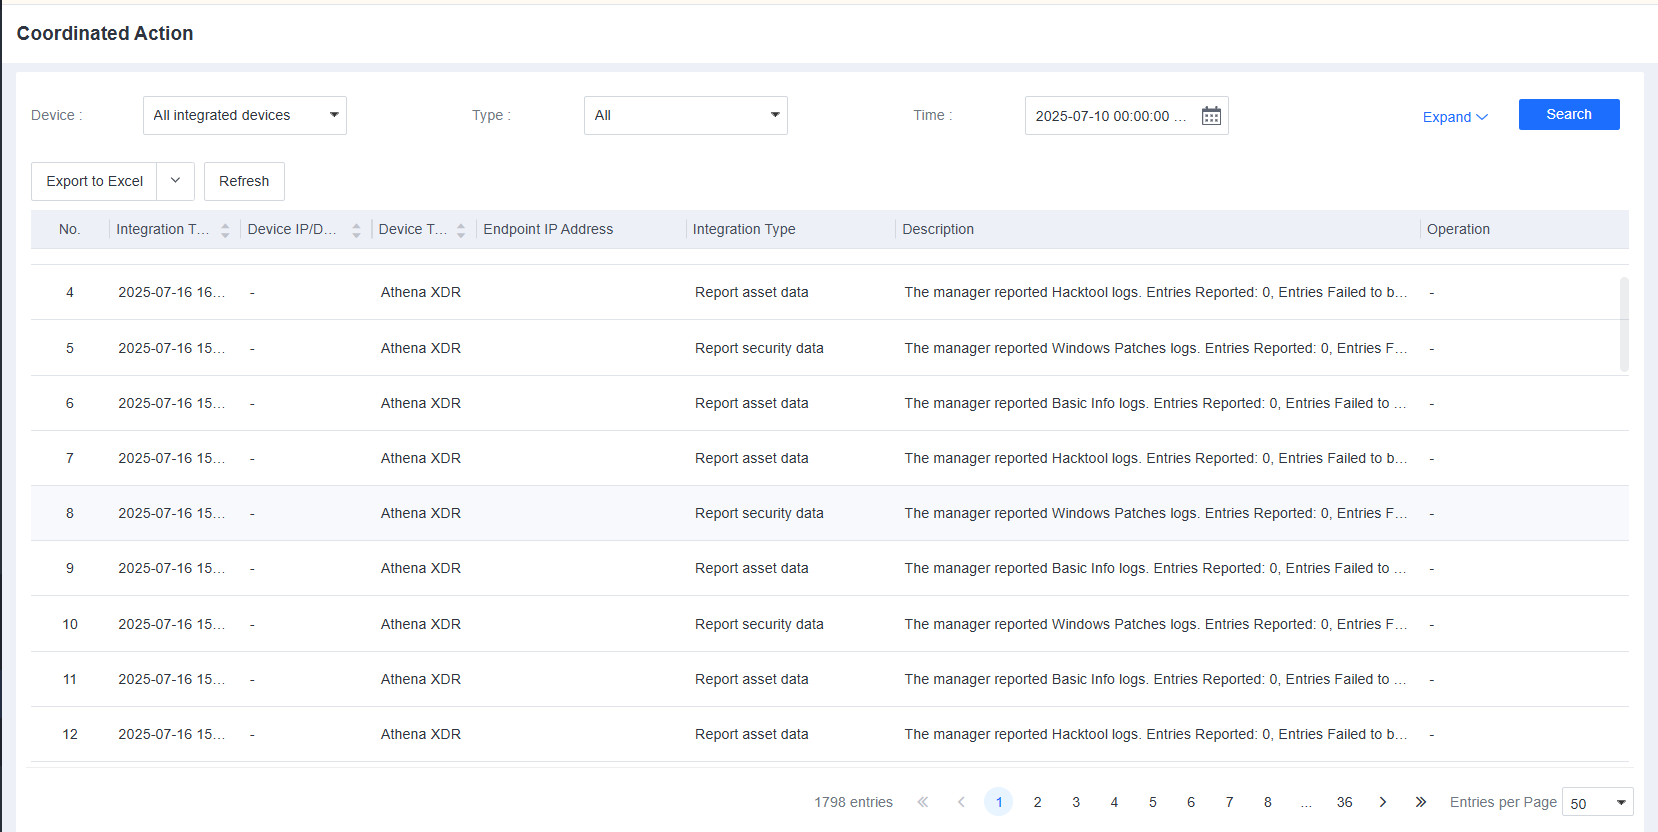
You can filter logs by device name, integration type, and time, and then click Expand to filter logs by endpoint name and IP address. Once you have applied your filters, you can export the filtering results.
On the Control Logs page, you can view what control operations have been pushed to the Athena EPP agent, including Hardware Changes, Unauthorized Outbound Access, USB Device Control, Software Uninstallation, and App Control.
On the Operations Logs page, you can select Upload Script File, Remote Support, and LDAP Sync History from the Operation drop-down list to view the corresponding operations logs. The log information is displayed in columns such as Time, Endpoint Name, IP Address, OS, Type, and Status, as shown in the following figure.
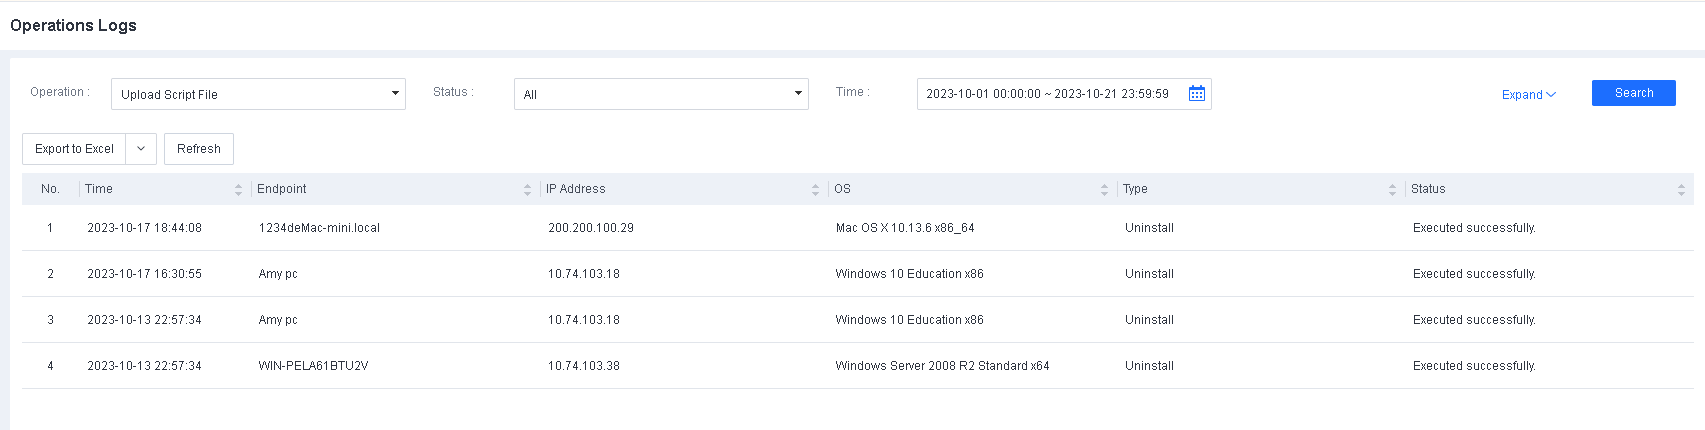
If you select Upload Script File, for example, you can filter logs by status and time, and then click Expand to filter logs by script file name, endpoint name, and IP address. Once you have applied your filters, you can export the filtering results.
On the Admin Logs page, you can view information about administrative operations performed on the Athena EPP manager. The log information is displayed in columns such as Time, Username, IP Address, Action, Module, Description, and Result, as shown in the following figure.
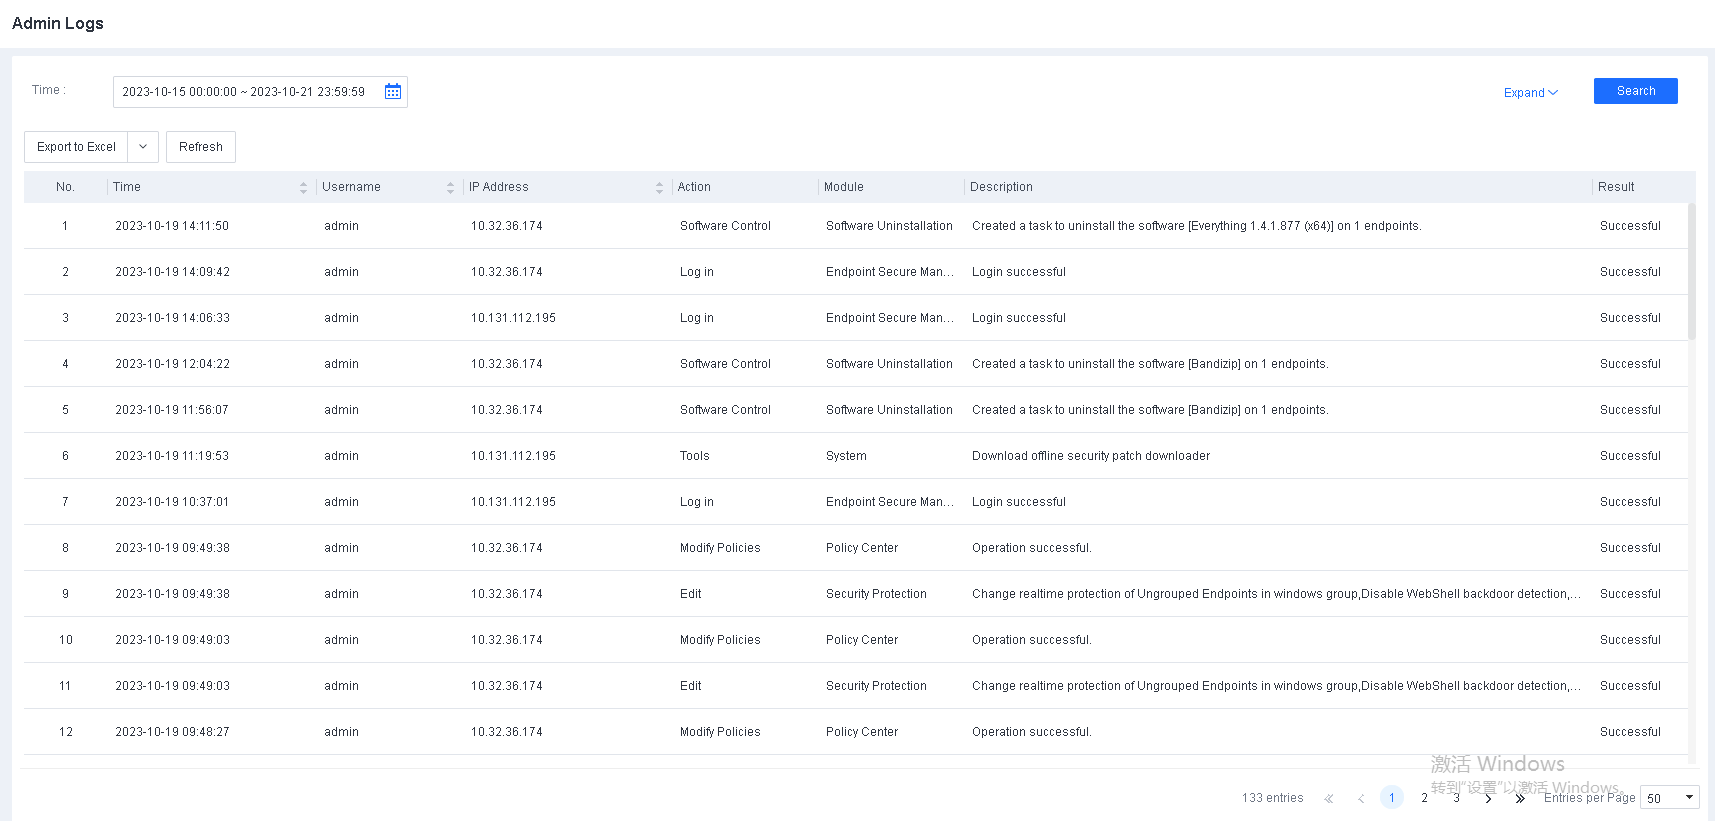
You can filter logs by time, and then click Expand to filter logs by username and IP address. Once you have applied your filters, you can export the filtering results.
Export a report
You can export risk reports of all managed endpoints from the Athena EPP manager for quick analysis and assessment of business risks and network security risks. When you export a report, you can specify its name and time range, as shown in the following figure. 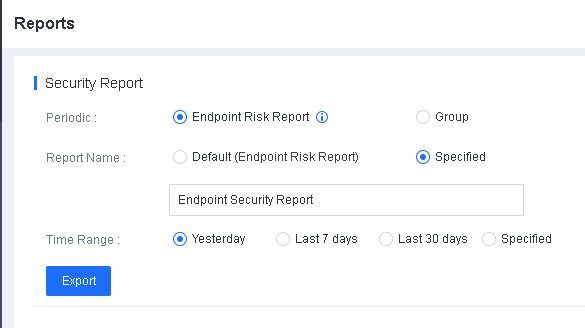
Subscribe to reports
You can subscribe to risk reports. In the Scheduling & Distribution section, specify the report name, report type, sending time, and recipients, as shown in the following figure. 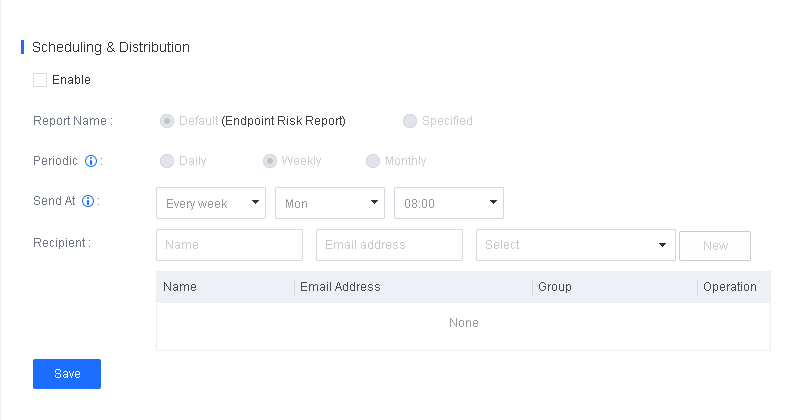
• Periodic: Valid values are Daily, Weekly, and Monthly, which refer to reports in one calendar day (00:00 - 24:00), calendar week (Monday - Sunday), or calendar month (1st day to the end date of the month).
• Send At: Specify the time when a security report will be sent to the recipients.

 {{ $t('index.defaultHeader.chromeBrowserTip') }}