{{ secondMenu.name }}


The Traffic Statistics panel displays traffic information about online users and applications, status information about Bandwidth Management channels, and connection monitoring information.
The Top Users by Traffic panel displays the bandwidth usage of online users. See the following figure.
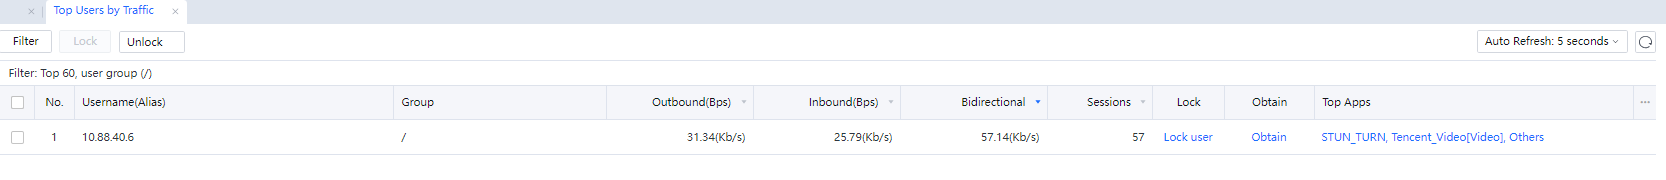
You can rank users by the Outbound or Inbound traffic rate. The displayed information includes the username, group, outbound and inbound traffic rates, bidirectional traffic, number of sessions, locking status, the button for obtaining the machine name, and traffic details. Click Lock user to restrict a user from Internet access; Click Obtain to obtain the computer name of the corresponding user. In the Top Apps column, click an application to display the traffic information about the user.
Click Auto Refresh: 5 seconds to set the refresh interval.
Click the refresh icon to refresh the information immediately.
3.3.1.6.1.1 Filtering Users
Click Filter to specify the conditions for filtering users by traffic. Set the Line and App Category. See the following figure.
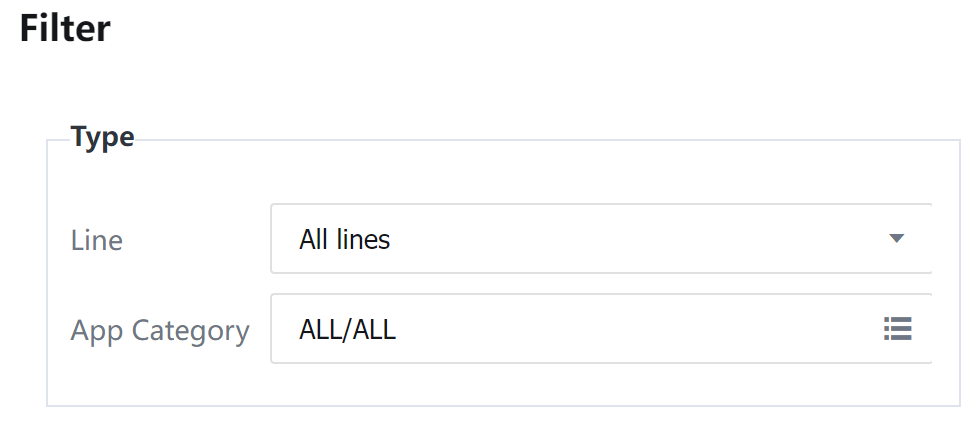
Line specifies the line to be viewed, and App Category specifies the application to be viewed. Select the App Category from the page below:
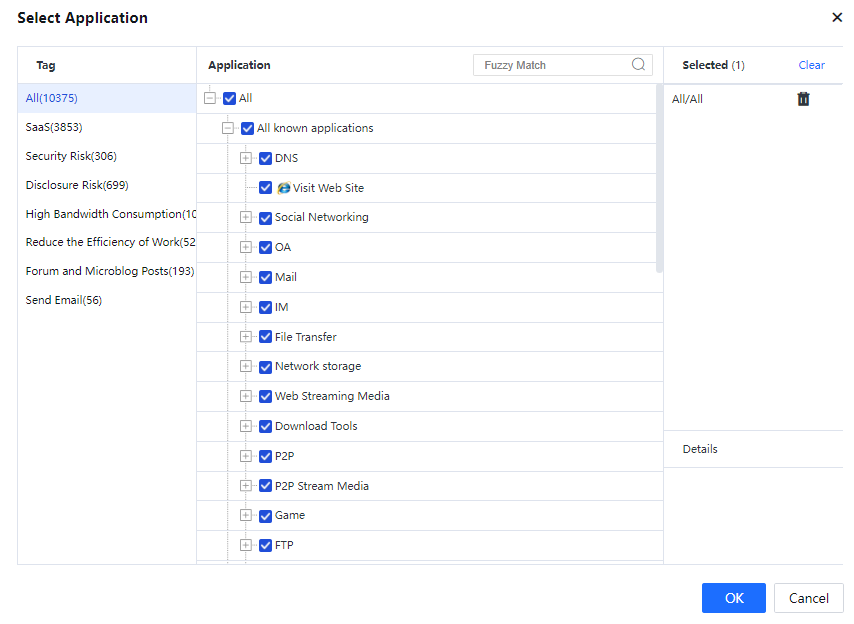
You can choose to display all applications, selected and unselected applications. The selected applications are shown in the right pane. Click OK to save the settings.
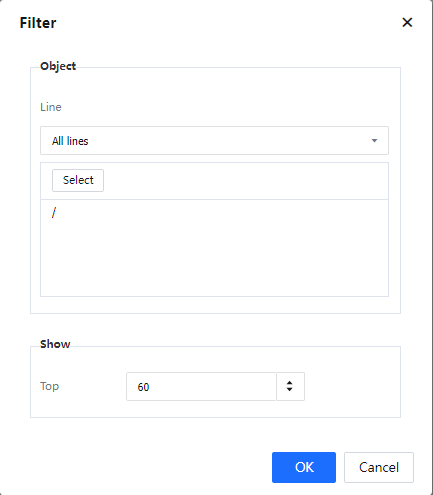
You can set the specific user or IP address in the Object pane. See the following figure.
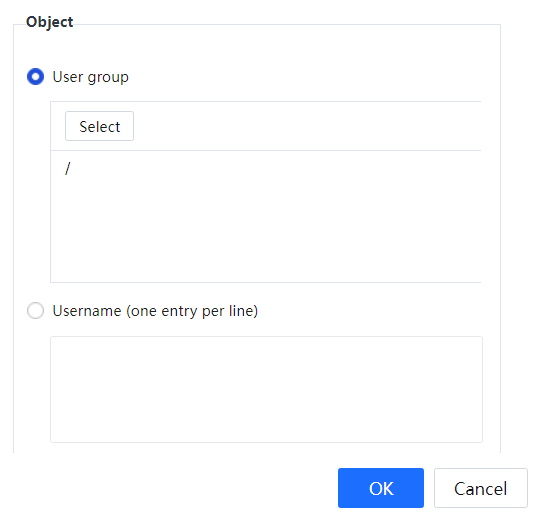
The User Group, Username, and IP address option buttons in the Object pane are mutually exclusive. Below User group, the slash (/) indicates all groups. After you click Select, the page in the following figure is displayed.
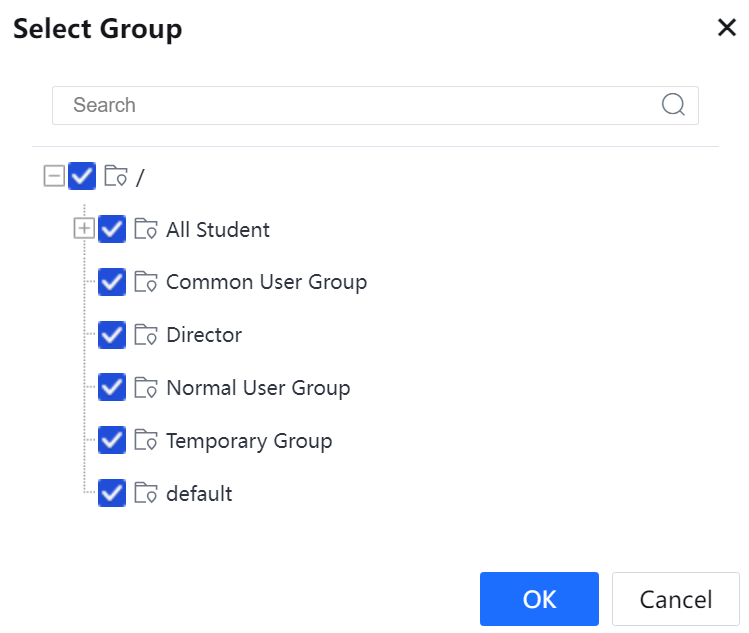
Select a group to view or enter a group name and click OK.
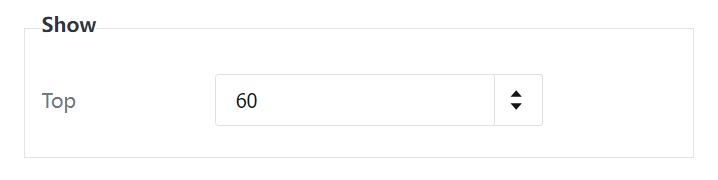
In the Show pane, you can set the number of displayed users ranked by traffic.
3.3.1.6.1.2 Locking Users
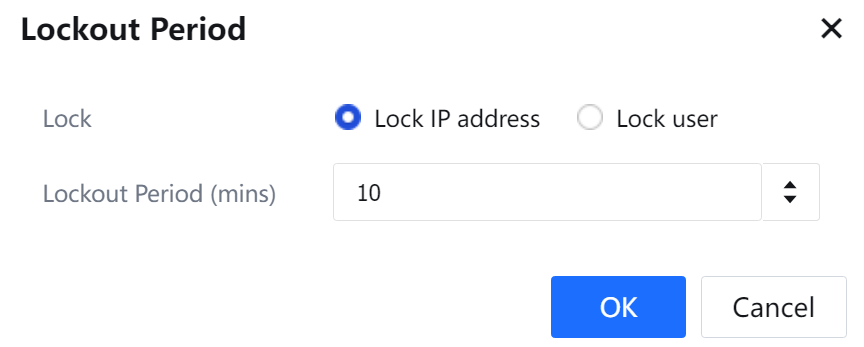
You can end a user connection by locking the user, and this user cannot access the Internet within a period. Specifically, select a user in Top Users by Traffic, click Lock, and set Lockout Period in minutes. See the following figure.
3.3.1.6.1.3 Unlocking Users
![]()
To unlock a user, click Unlock.
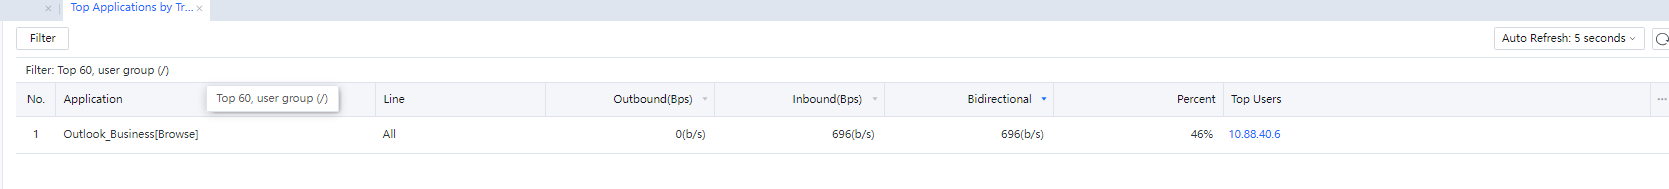
The Top Applications by Traffic panel displays rankings of applications by traffic in real time. See the following figure.
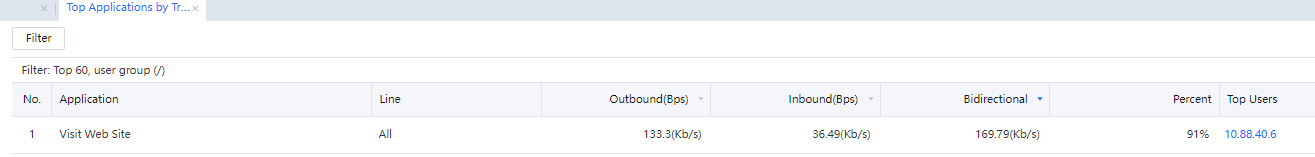
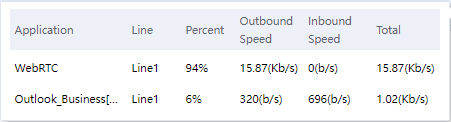
You can filter applications by bandwidth. The displayed information includes the application type, outbound and inbound traffic rates, bidirectional traffic, line, occupied bandwidth in percentage, and user details about the application. Click a user in the Top User column.
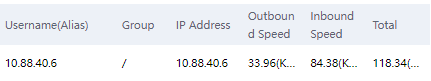
Information about this type of application users is displayed, including the username, group, IP address, upload rate, download rate, and total rate. See the following figure.
Click Auto Refresh: 5 seconds to set the refresh interval. Click Refresh to refresh the information immediately.
3.3.1.6.2.1 Top Applications by Traffic
Click Filter to specify the conditions for filtering applications. See the following figure.
In the Object pane, set the line and user group. Then, set the number of displayed applications ranked by traffic in Show. Finally, click OK.
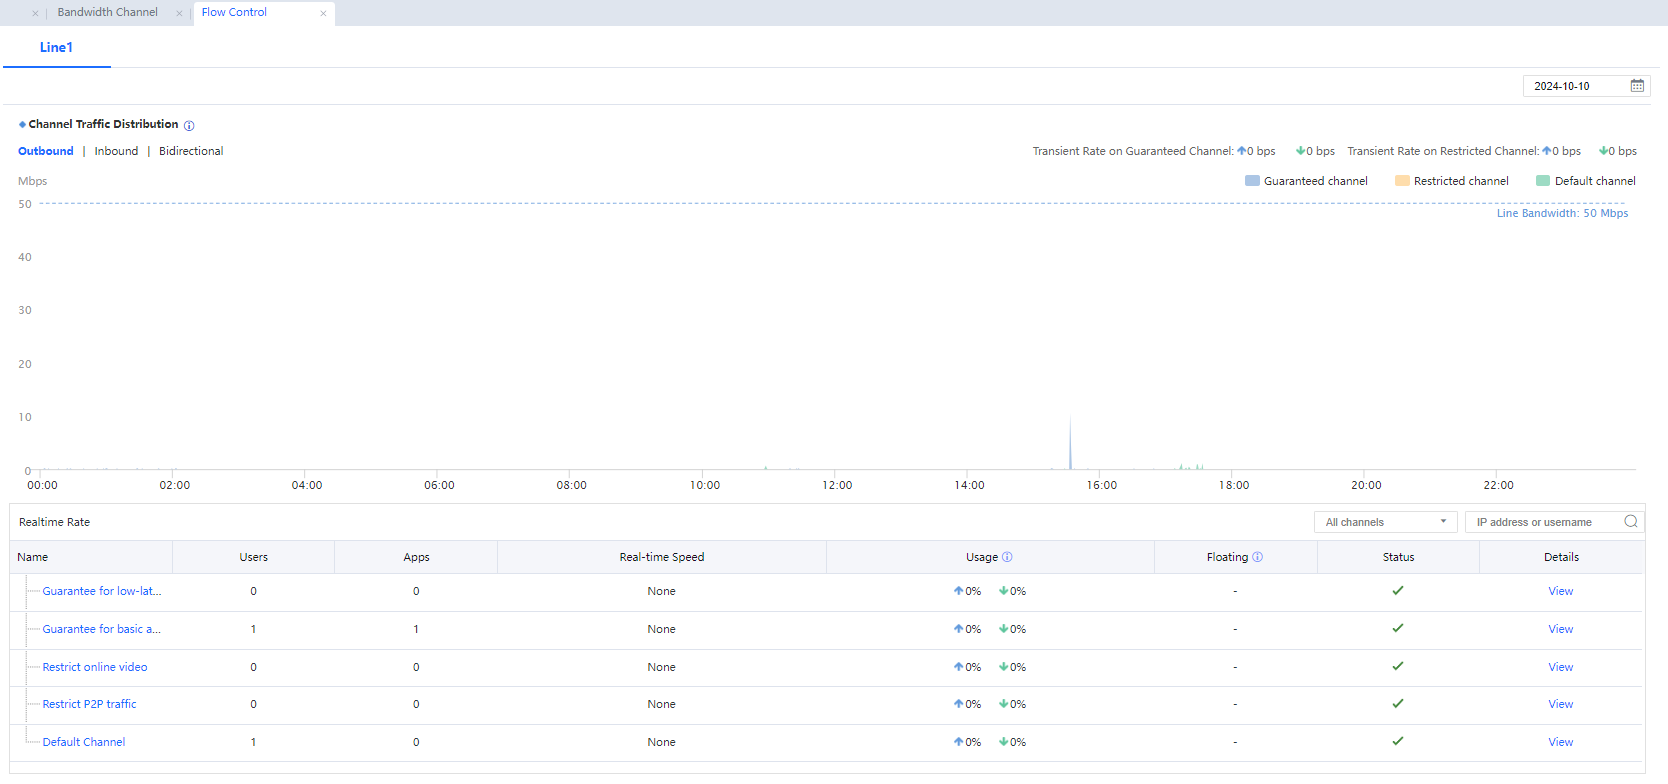
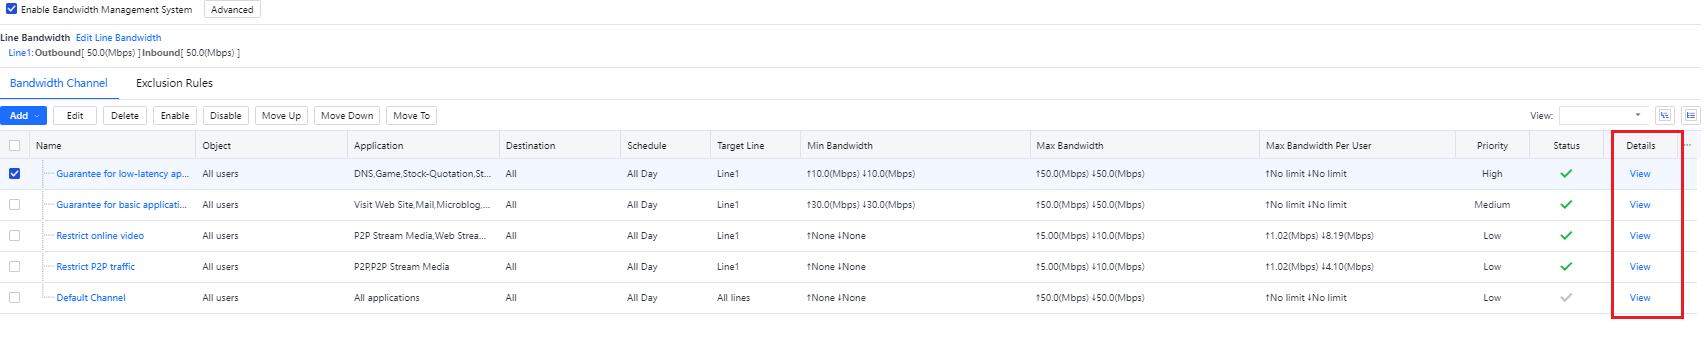
Flow Control is to check flow control settings, channel traffic distribution, etc., provided the flow control channel has been enabled. The interface is as follows:
3.3.1.6.3.1 Scenario and Method
3.3.1.6.3.2 Initial Launched Device Scenario
Scenario: The core requirement is to improve the Internet experience in areas with sufficient bandwidth. So, enabling flow control and default configuration may improve the internet experience significantly. However, IT administrators cannot view the traffic usage after enabling flow control. There is no visual feedback in subsequent adjustments, resulting in high operation and maintenance costs.
IT administrators need to implement relatively fine bandwidth management in areas with tight bandwidth. However, if the initial implementation is inexperienced, you can use the default configuration first, check the current usage, and make adjustments.
Provides overall line and channel visualization to help users analyze flow control results after launch.
Analysis Method:
IT administrators linked to Flow Control can check several core elements first:
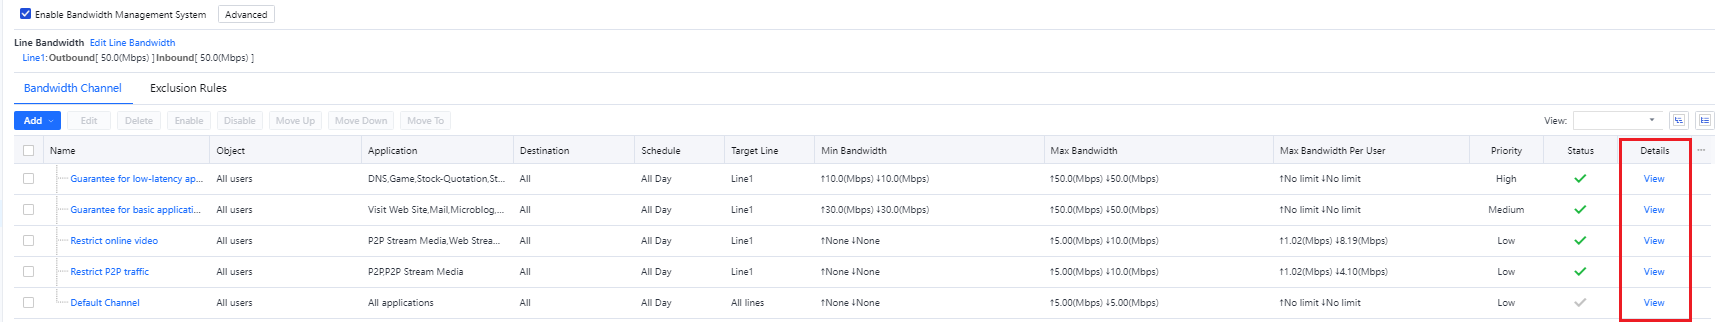
Check the flow usage of the uplink and downlink of the line, including the guaranteed and restricted channels, and support the transfer to the top N primary channel to evaluate whether the channel occupancy meets expectations.
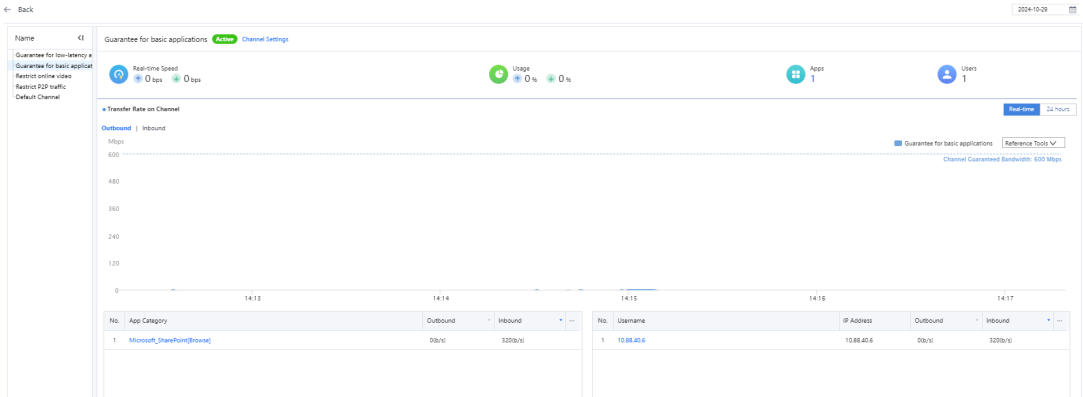
Users can check the real-time flow and number of users through Details and click to enter the channel.
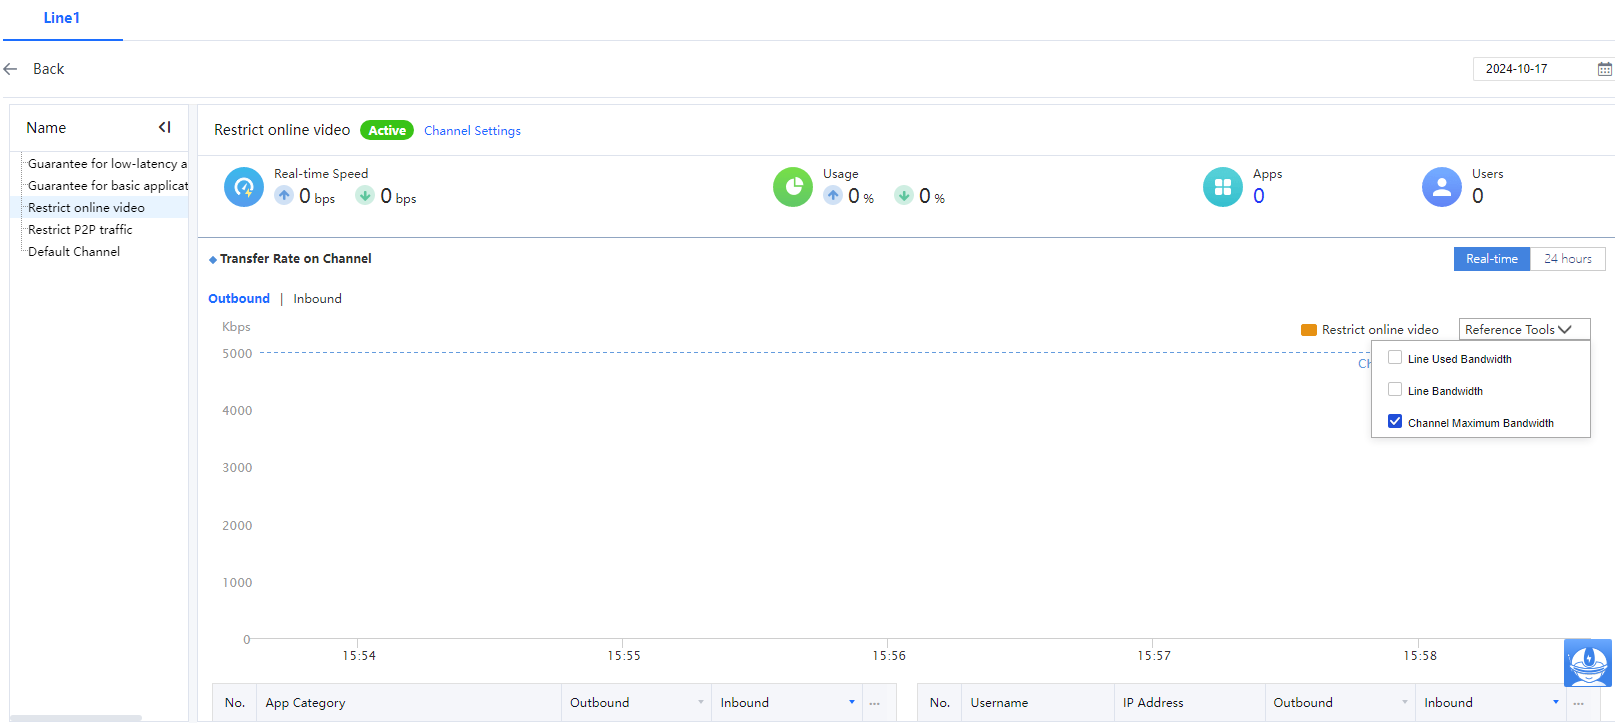
Users can determine the overall status of the channel by checking the current real-time speed, uplink and downlink usage, number of apps, number of users, and idle line bandwidth.
If the overall line is idle, but the flow usage is high, you can click Channel Settings to modify the channel configuration.
The IT administrator can directly click on the subchannel in the flow rate details to view it or use the left tab to jump to any other subchannel and check the flow details.
Check the relationship between the pre-channel flow throughput and configuration, including the channel usage rate and the parent channel idle bandwidth.
Check whether the app usage in real-time flow is as expected.
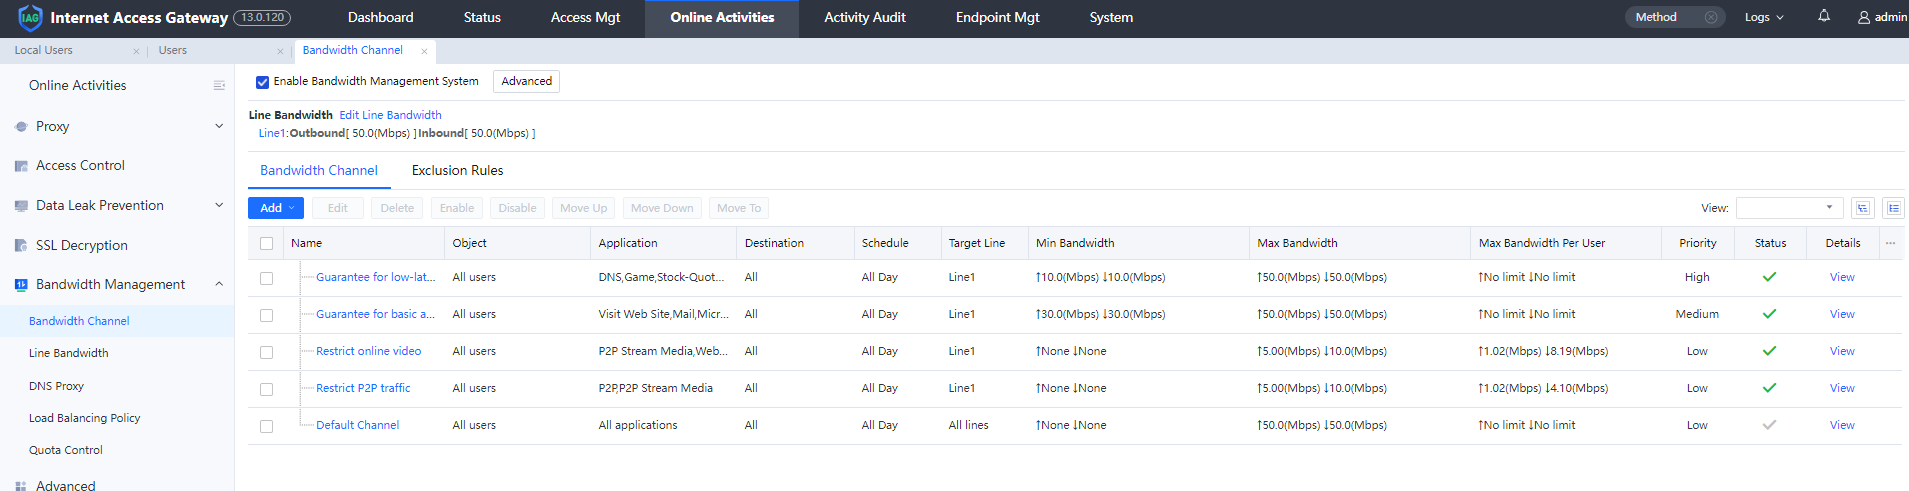
3.3.1.6.3.3 Daily Operation and Maintenance Scenario
Scenario:
After the Flow Control is enabled, the administrator cannot check the flow usage in the Enable Bandwidth Management System due to the lack of visualization. As a result, the administrator cannot evaluate the flow control configuration or adjust the channel configuration to distribute the flow better.
Provides overall line and channel visualization to help users analyze the results after flow control.
Analysis Method:
![]()
If the device is deployed in bridge mode, you need to configure the Virtual Line Rules first.
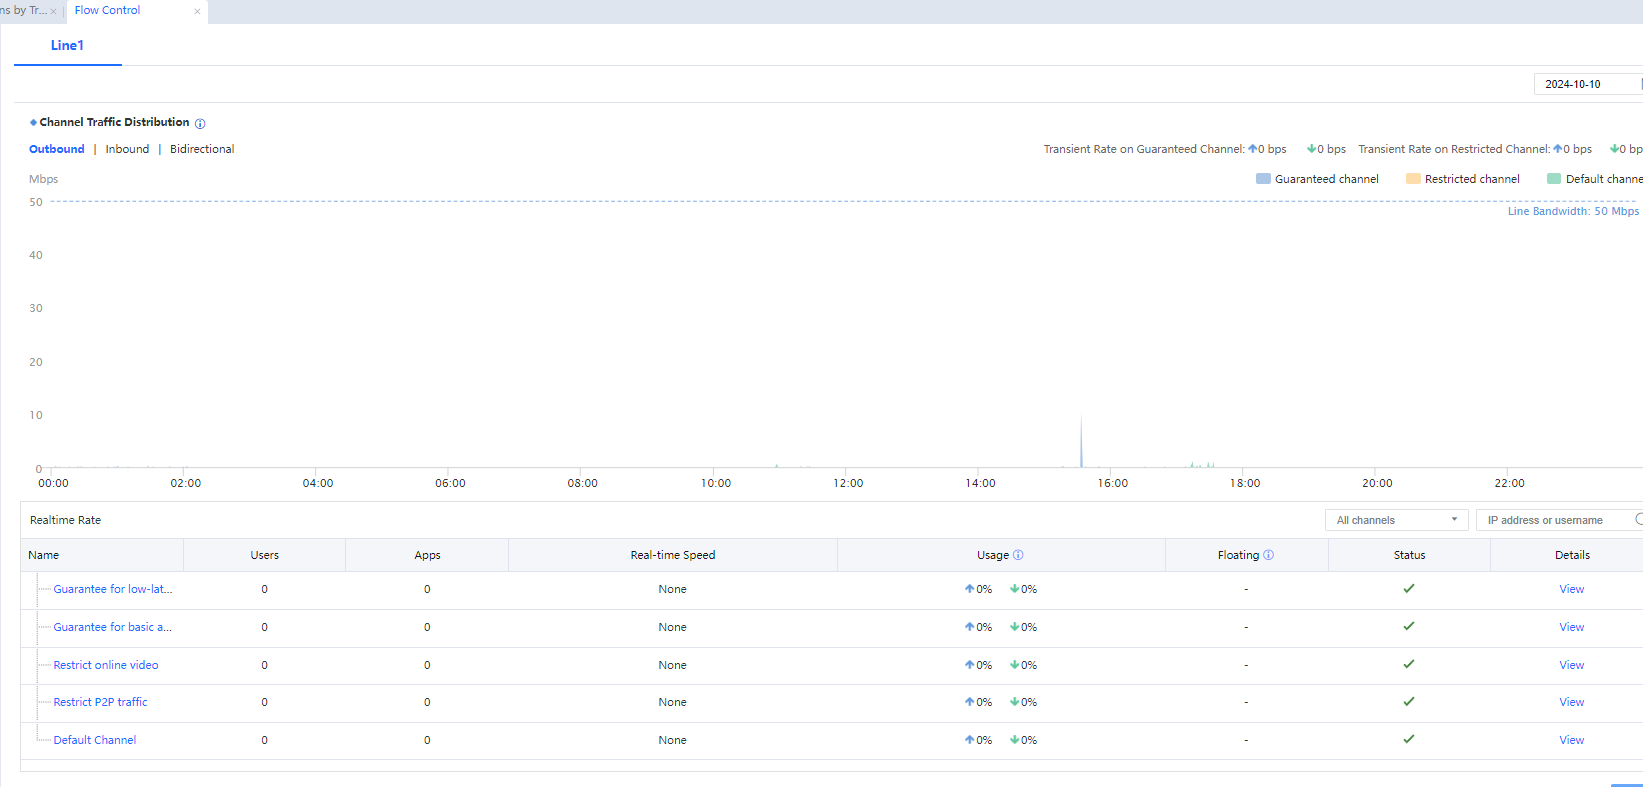
IT administrators can check the bandwidth status of each line on Flow Control.
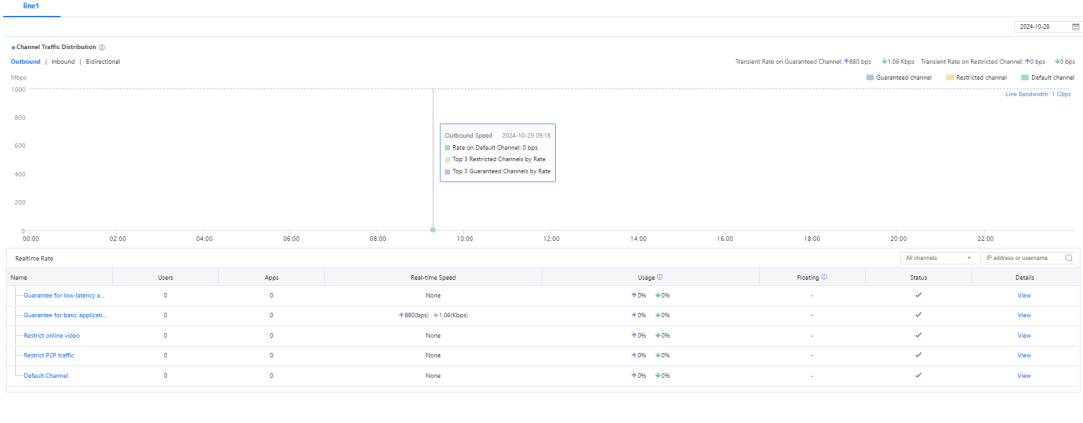
Check the flow usage of the uplink and downlink of the whole line. The administrator can view the 24-hour bandwidth idle condition of the line (the line bandwidth in the above figure minus the highest point of the area map) and the Top when the traffic usage ratio is high (guaranteed channel/ limited channel) channel condition.
The difference between the used bandwidth and the line bandwidth (i.e., the bandwidth of the current line idle) can be visually seen from the diagram.
Condition of guaranteed channel/ limited channel:
For example, the flow usage of the guaranteed channel has been too small, and the user can check the flow throughput in the guaranteed channel.
You can click the area map of the guaranteed channel/ limited to jump to the top three area maps of the corresponding channel type.
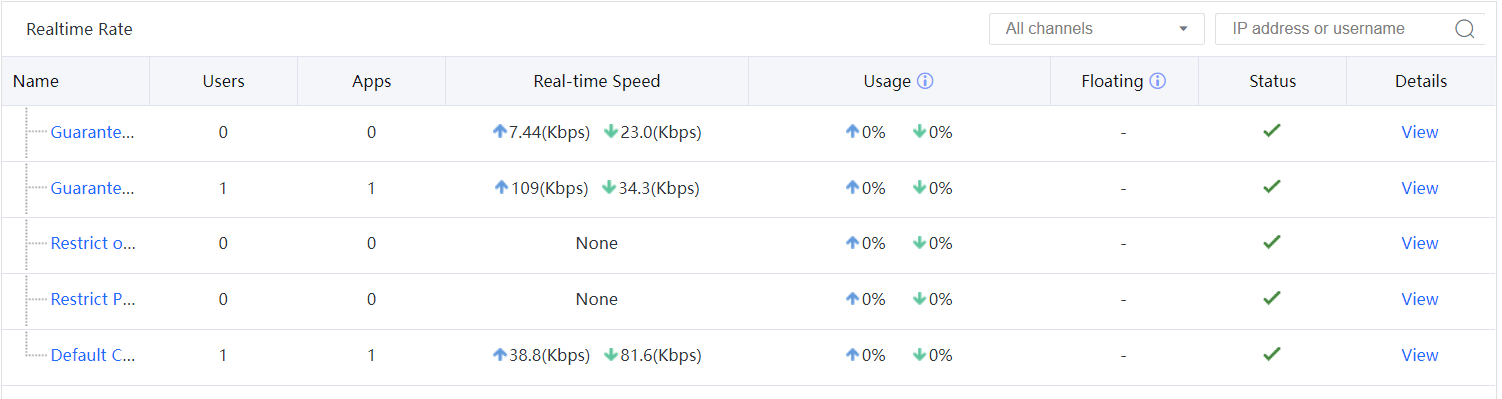
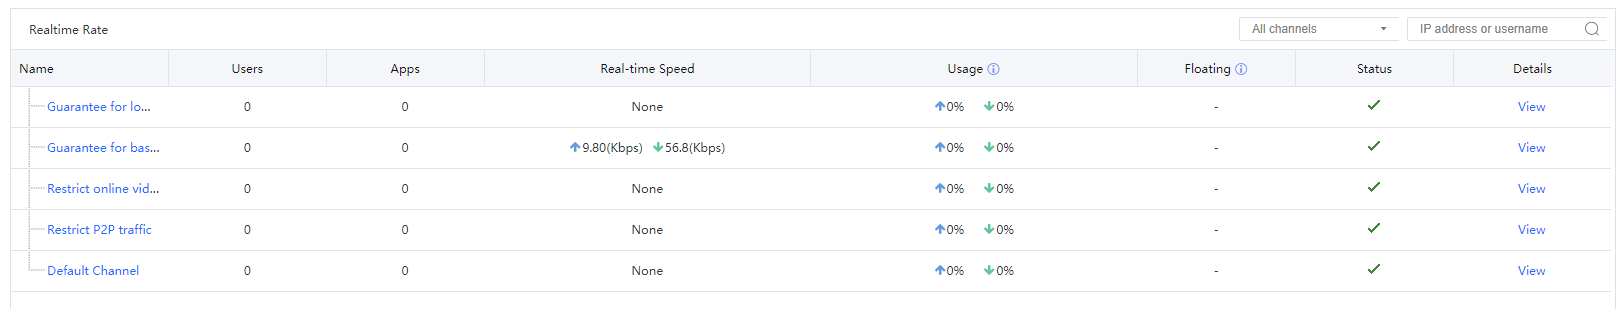
Check the Realtime Rate to view the real-time rate of the channel list. It can be combined with the line bandwidth and real-time usage rate to determine the channel for viewing.
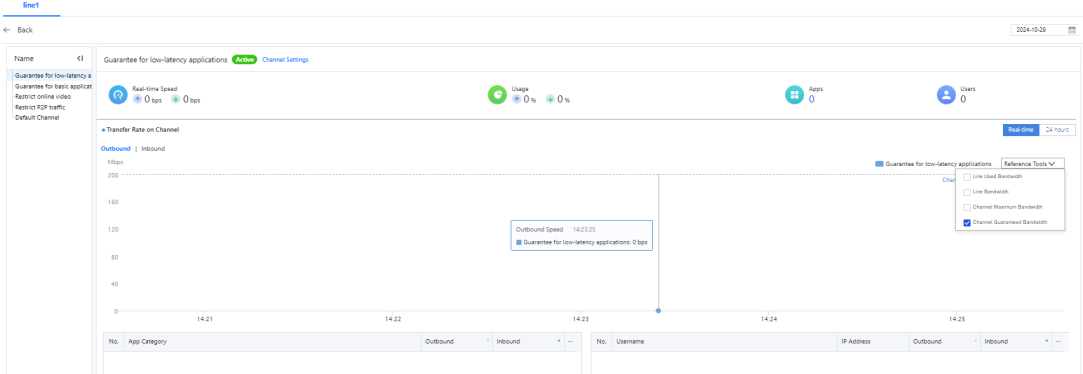
After entering the channel, the IT administrator can check the following:
Click to check the channel, and the real-time rate is high. View the throughput of the primary channel and the user/app ranking.
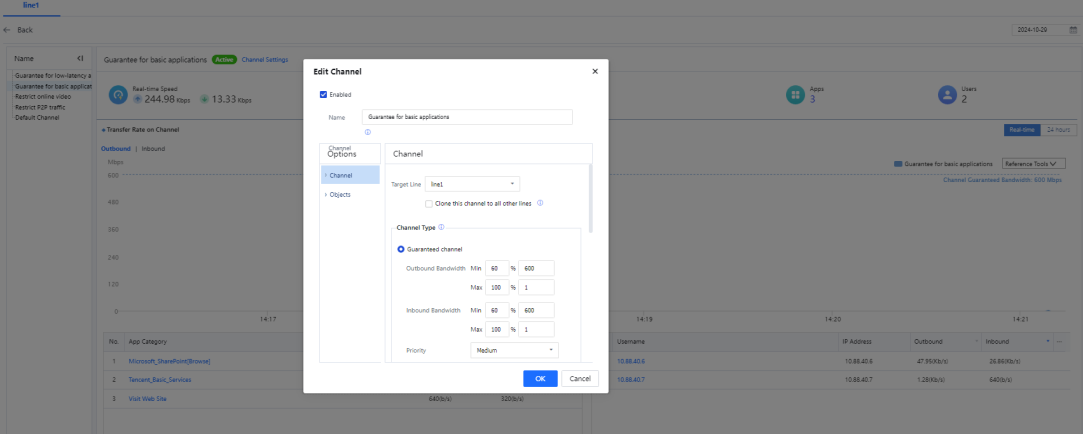
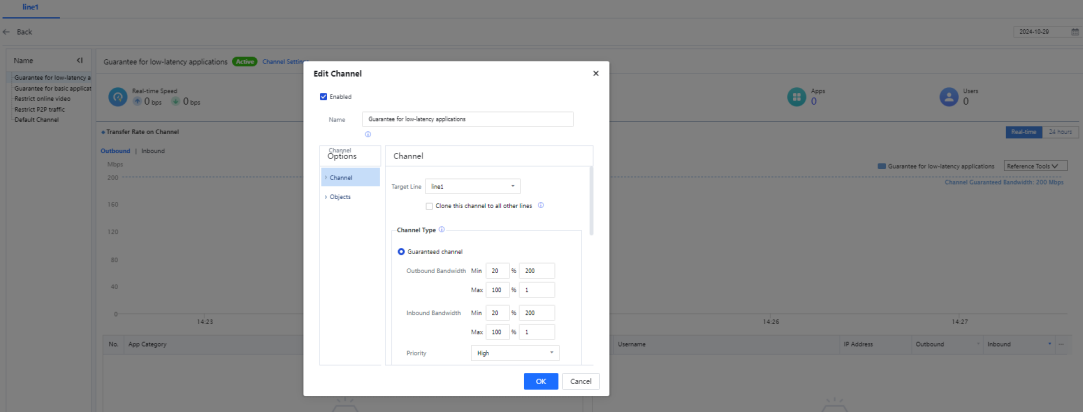
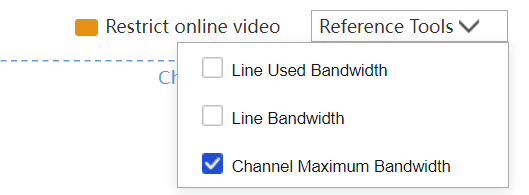
If you enter the guaranteed bandwidth, you can see the usage information of the guaranteed bandwidth in the line and provide four reference lines: used bandwidth, line bandwidth, maximum available bandwidth, and the latest guaranteed bandwidth.
After checking the throughput and comparing the bandwidth used, the administrator can adjust some channel configurations and increase the bandwidth utilization.
Click Edit Channel, enter the maximum available value, and click OK.
Modify the configuration. Then, the throughput diagram will be displayed in 5 minutes, showing the effect quickly.
3.3.1.6.3.4 New Service Scenario
As business cloudification deepens, the original LAN app moves to the Internet, or new Internet services appear. As a result, IT administrators need to protect new services and face the problem of redistributing bandwidth.
Provides line and channel visualization to help administrators allocate bandwidth to new services.
Analysis Method:
The administrator can check the usage of the current channel and the overall line's idleness to ensure that the new configuration is reasonable.
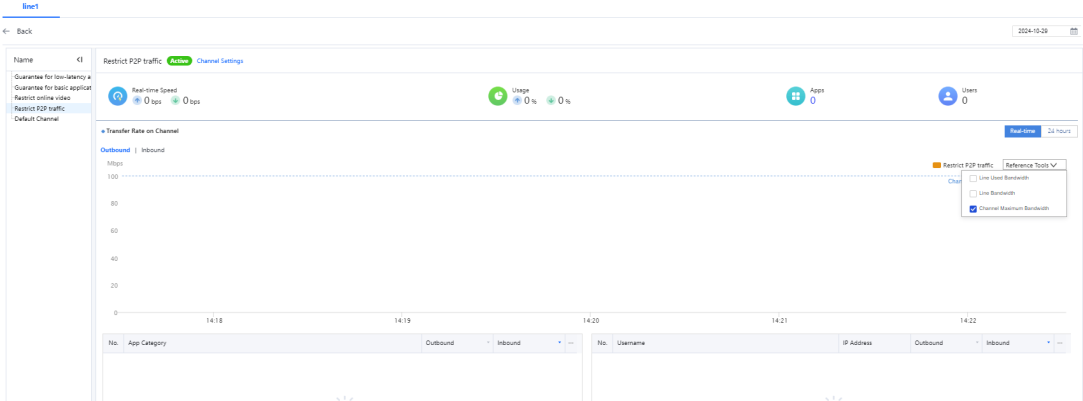
Status seen from the figure can be decomposed into four parts: 1., 2., 3., 4.:
For example, this is limited bandwidth, its speed is limited to 32 Mbit/s, and the occupied bandwidth is continuously lower than the maximum available bandwidth of the channel, indicating that the channel is healthy.
If it continues to be equal to the maximum available bandwidth of the channel, the channel pressure is high; If you select When the line is idle, it is allowed to exceed the limit. When the whole line is idle, the line will exceed the maximum available bandwidth.
You can also see the channel's top N of-user and application flow rankings.
After the operation above, the IT administrator can quickly guarantee the new services, check the historical channel congestion Flow Control Status when the whole line is busy, allocate and adjust the flow, or upgrade the bandwidth.
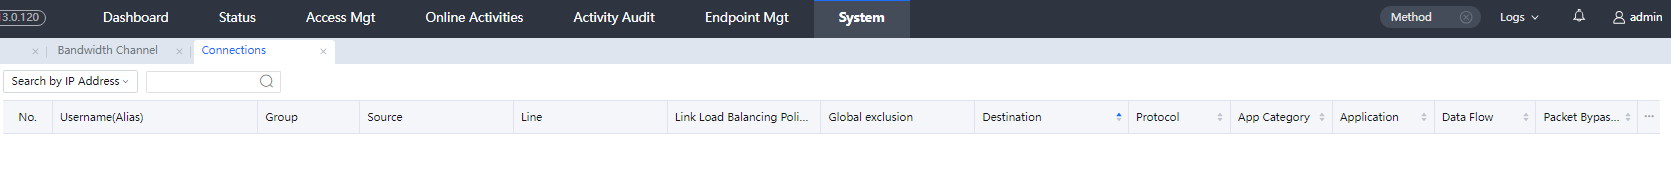
The Connections panel displays information about active connections of specified users or IP addresses. You can query the information by IP address or username. See the following figure.
3.3.1.6.4.1 Search by IP Address
By default, connection information is queried by IP address. For example, enter 10.88.40.6 and click ![]() . As a result, it will display the page shown in the following figure.
. As a result, it will display the page shown in the following figure.
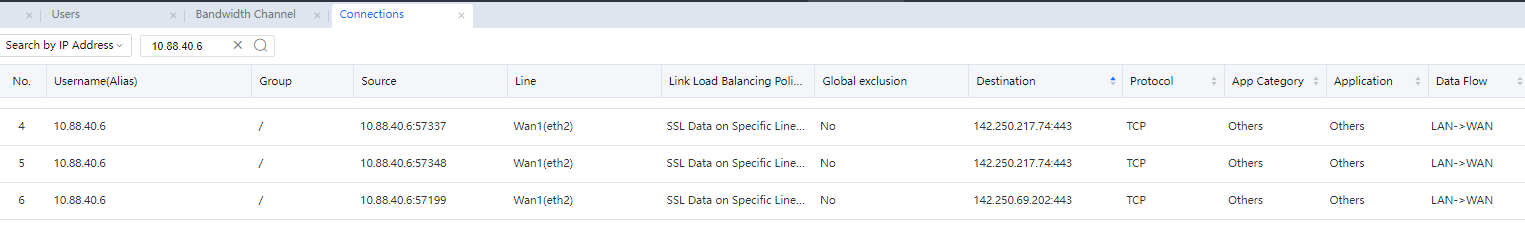
You can view the information about the entered IP address connections, including the source IP address, destination IP address, protocol, application type, application name, and direction.
3.3.1.6.4.2 Search by Username
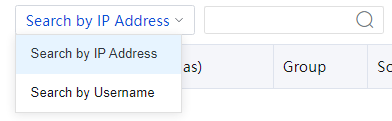
Click Search by Username to query connection information by username. See the following figure.
Quota Usage allows you to view the usage of a specified user or quota policy and execute the reset operation. See the following figure.
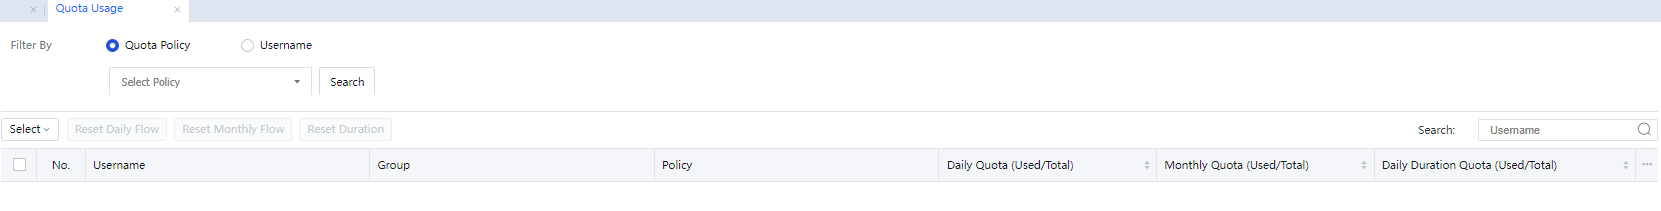
Configure and enable Status > Traffic Statistics > Quota Policy in advance.
Select query conditions: Support querying by the quota policy or the user.
Support resetting: Select a user and reset the daily flow, monthly flow, and duration.
The link load balancing status can display the current link status (normal, busy, offline, no data), the TOP5 link bandwidth utilization (outbound, inbound), and the distribution of policy traffic.
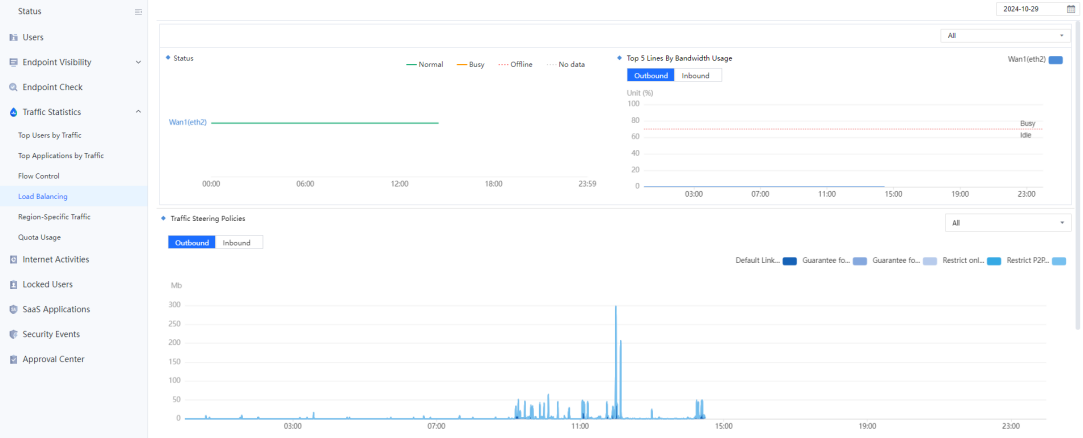
The administrator can also view the real-time information of the link load balancing policy, including the real-time and cumulative traction of the day.
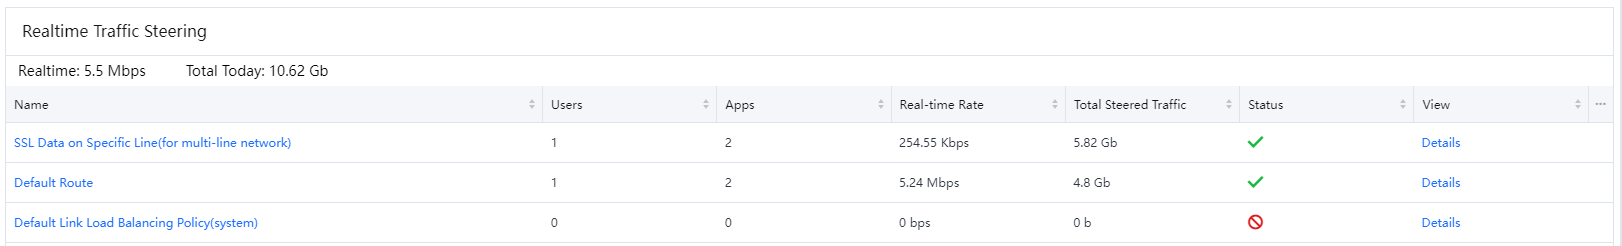
The administrator can click on any policy name or details to redirect to the policy details description.
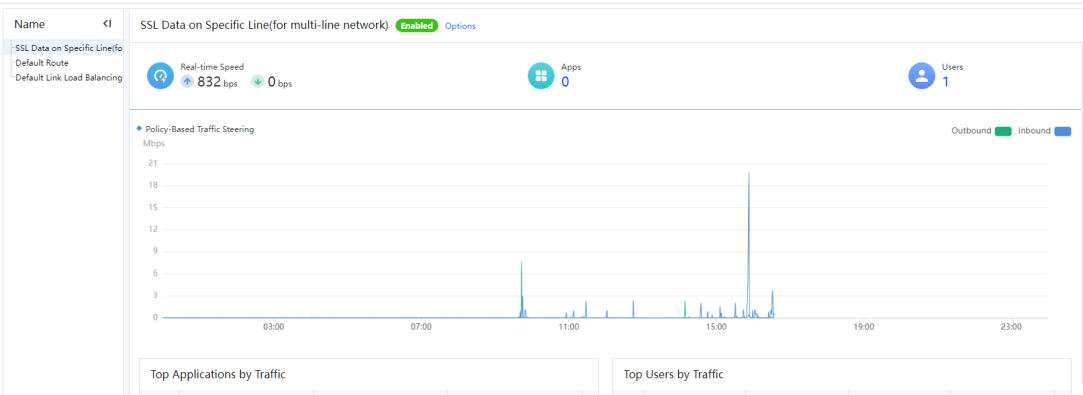
On this page, administrators can view the current business traffic conditions, including business IP ports and outbound and inbound flow rates.

 {{ $t('index.defaultHeader.chromeBrowserTip') }}