{{ secondMenu.name }}


Troubleshooting Center includes six parts: Network, Authentication, Ingress Client Decryption, Access Control, Web Access Connection Monitoring, and User-Based Detection. It is to help operators, engineers, and other professionals to conduct self-inspection of failure. The interface is as follows:
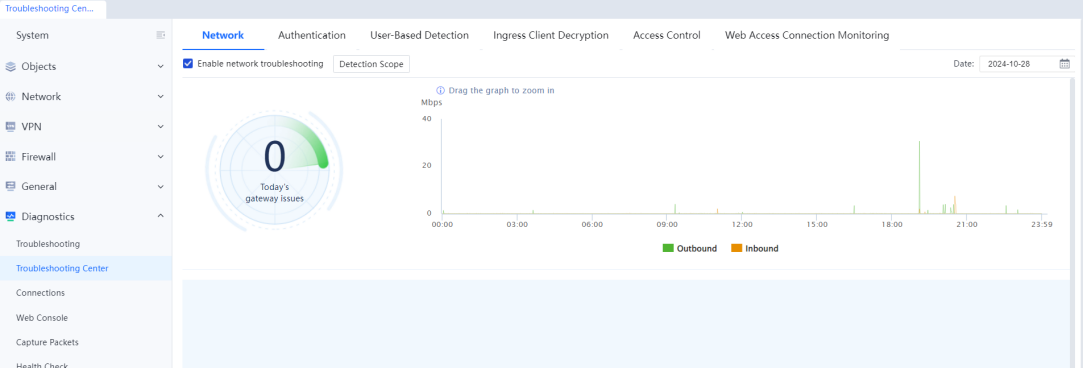
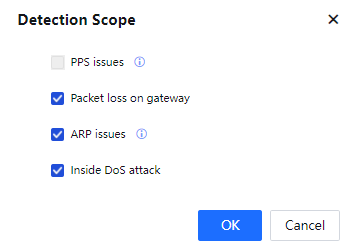
Network Troubleshooting monitors network status. When the network is abnormal, it provides a reference solution. These are the four types of abnormalities that can be identified:
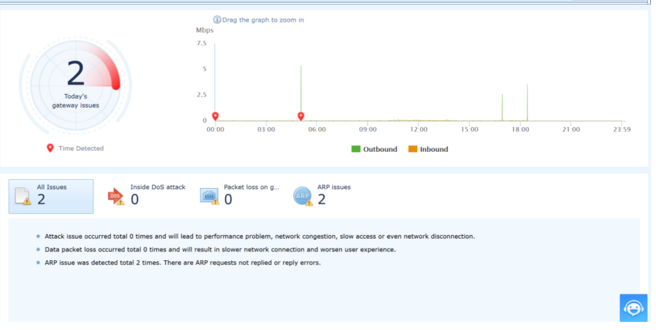
Inside DoS Attack
Introduction: The attack issue occurs xx times, leading to performance problems, network congestion, and worsened user experience.
Failure type: Inside DOS Attack.
Solution: Please check whether the network topology changes from a loop. Please isolate devices of the corresponding IP and perform virus detection on the device.
Packet Loss on Gateway
Introduction: Data packet loss occurs xx times, resulting in slower network connection and worsening the user experience.
Failure type: rx_crc_errors.
Solution: This error indicates failure in the physical layer of packet transmission. Please replace the network cable that connects to the corresponding gateway or the peer gateway directly connected to the network cable.
ARP Issues
Introduction: The ARP issue was detected xx times. There are ARP requests not replied to or reply errors.
Failure type: ARP Abnormal.
Solution: Please check the operation status and connectivity of the gateway device.
PPS Issues
Introduction: PPS Overrun was detected xx times, which caused the device to fail all control and audit functions.
Failure type: PPS Issues.
Solution: When the device exceeds the PPS limit, the current device performance is insufficient. Splitting the traffic passing the device or contacting the business channel to use a higher-end platform device is recommended.
The effect is as shown in the figure:
The line chart can be dragged. Zoom in to show the particular period. The reset button is on the right side. The function needs to be enabled by needs.
Detection Scope:
After the Internet policy is configured, the user matching issues cannot be detected by engineers. It can only be searched slowly through pass-through mode and is low efficiency. To solve the problems, Sangfor has launched the Access Control Troubleshooting tool.
The tool checks the match between the user and the Internet access policy. When the user matching the policy does not meet the actual expectations, the operation and maintenance personnel or engineers can use this function to check.
Enter the IP address of the abnormal user in the input box and click Start to see all the policies that the user matches. Then, find the issue based on the comparison with actual expectations and adjust the policies.
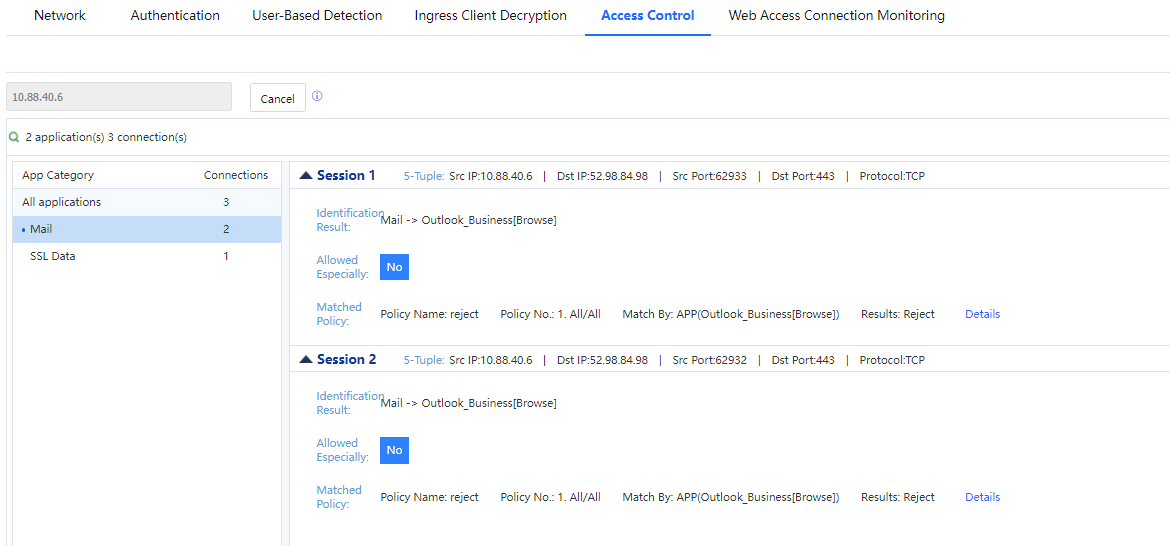
Analysis of user status based on tracking results.as w
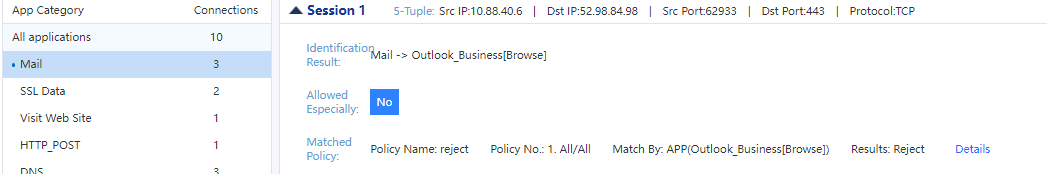
You can see the App Category matched, five-tuple of each, whether it is matched, and whether it is specially released (overall exclusion)
After the LAN user is associated with the authentication policy, the user matching issues cannot be detected by engineers. It can only be searched slowly through pass-through mode and is low efficiency. You may contact 400 engineers for remote investigation, but it lacks autonomy. To solve the problems, Sangfor has launched the Authentication Troubleshooting tool.
The tool checks issues during the authentication process. Then, it displays the result in the console so that the operation and maintenance personnel or engineers can locate and solve them.
Enter the abnormal user's username, IP address, and Mac address in the input box and click the search icon. You can see the issue during the authentication process, follow up prompts and adjust the issued configuration or environment.
![]()
It monitors the device's network quality and evaluates its network status and IP addresses. There are two kinds of results: excellent and poor. When the result is poor, it will provide potential problem analysis suggestions to check the current network quality monitoring status, recent network quality, current network quality, and network diagnostic results.
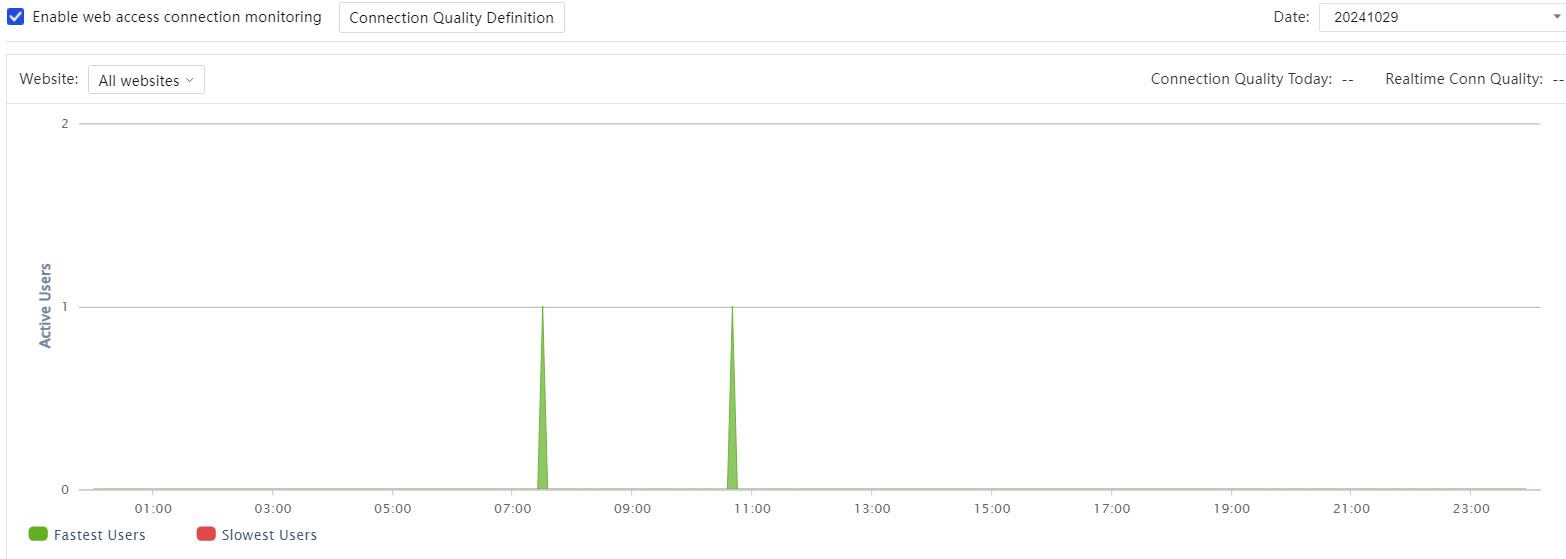
Select Enable web access connection monitoring and choose Yes according to the prompt.
Click Connection Quality Definition to configure the quality definition of the monitored network.
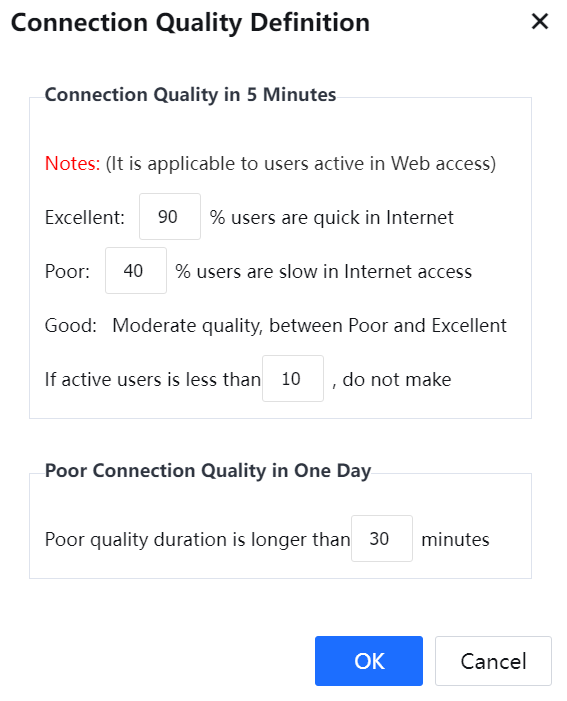
Connection Quality in 5 Minutes: Record once every 5 minutes.
There are three default quality definitions: excellent, good, and poor. In addition, users can customize the monitoring percentage.
The statistic can be customized when active users are less than N. The default is ten users, and you can enter a number between 1 and 100.
Poor Connection Quality in One Day: The network quality is poor when all-day quality monitoring exceeds N minutes. The default value is 30 minutes, and a number between 10 and 300 is allowed.
Date: You can select a specific day in the last week to check the connection quality in the selected day.
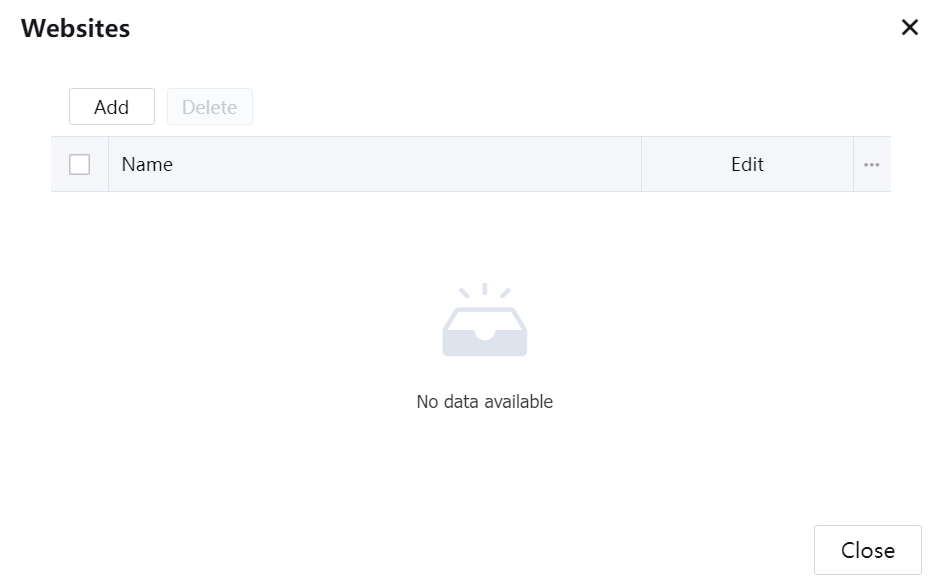
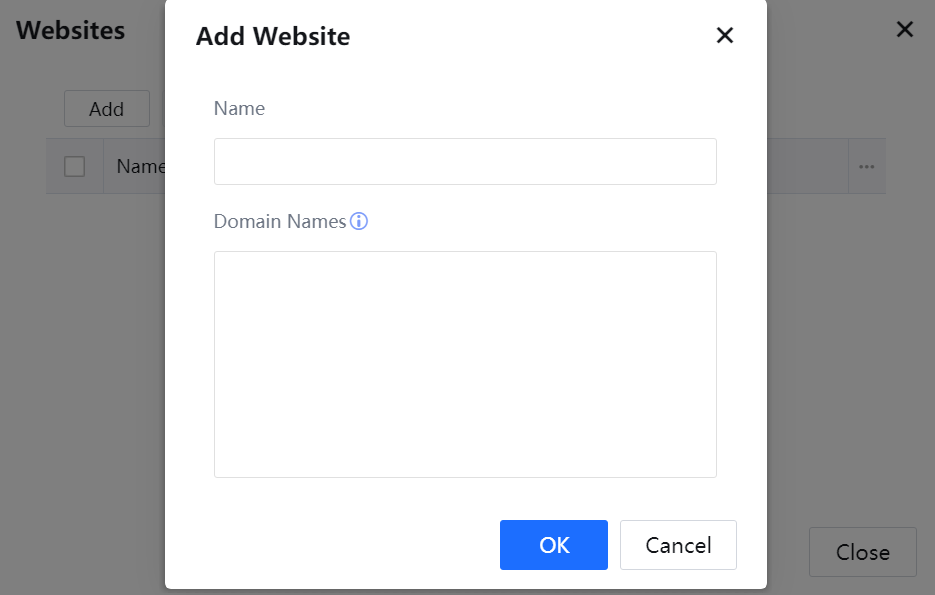
Website: To select monitored websites. All websites are chosen by default. Users can also specify which websites to monitor. You can set up three monitoring lists, each with a maximum of 100 domain names. Click the custom website list to switch to the monitored website.
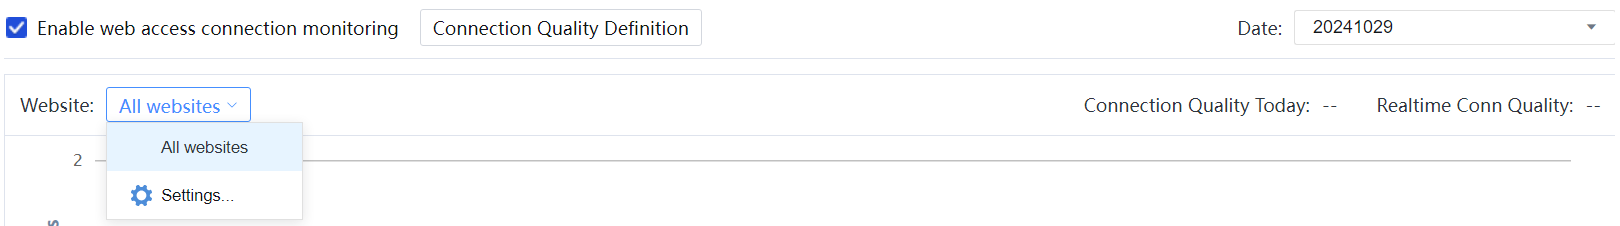
Click Settings to edit the website list.
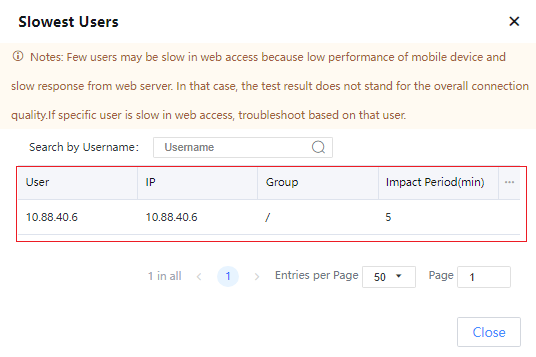
Move the mouse to the waveform, and a floating box will appear. You can see the detailed network quality status. You can click it to view and check the slow user list when the network quality is poor.
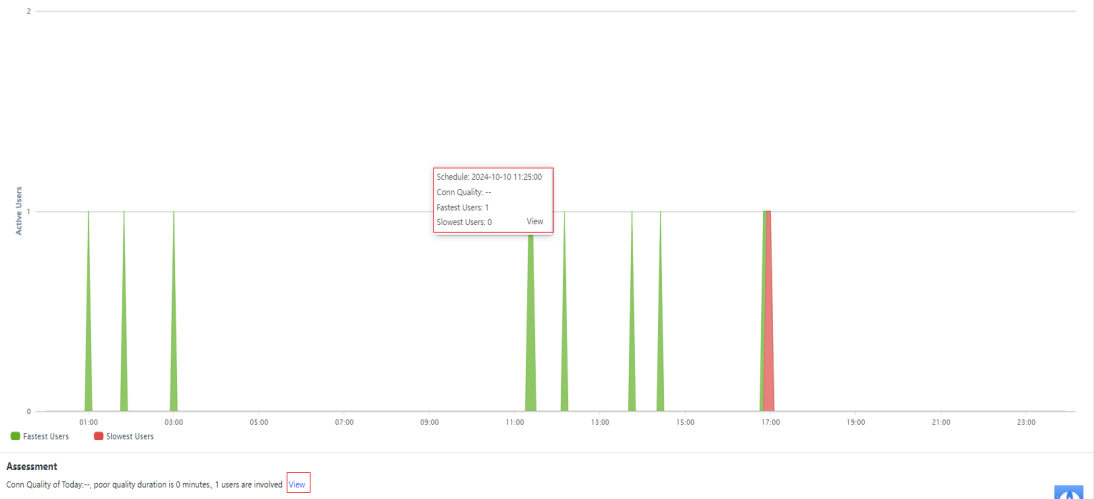
The x-coordinate is time; each coordinate point is five minutes: 00:00, 00:05, 00:10 and shows the user information summary within the previous 5 minutes. For example, if the x-coordinate is 00:05, the coordinate point shows the summary of 00:00 to 00:05.
The y-coordinate is the number of online users and the sum of users with excellent and poor network quality.
Move the mouse to the waveform to check the number of users with excellent and poor network quality at the current time.
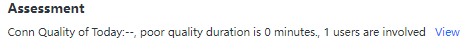
Assessment can be used to check the detailed network quality and show you several reasons for poor network quality:
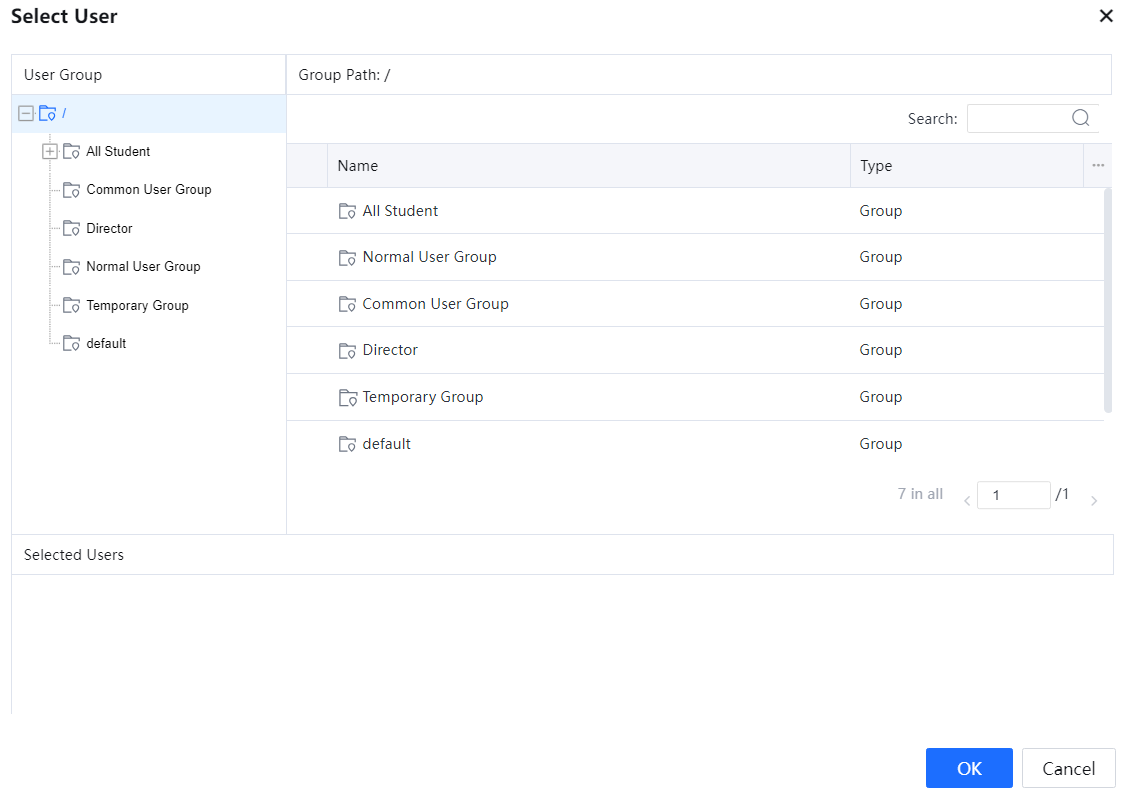
Provides a single-user detection function, which can perform targeted detection for single users when the overall network quality judgment cannot solve the problem.
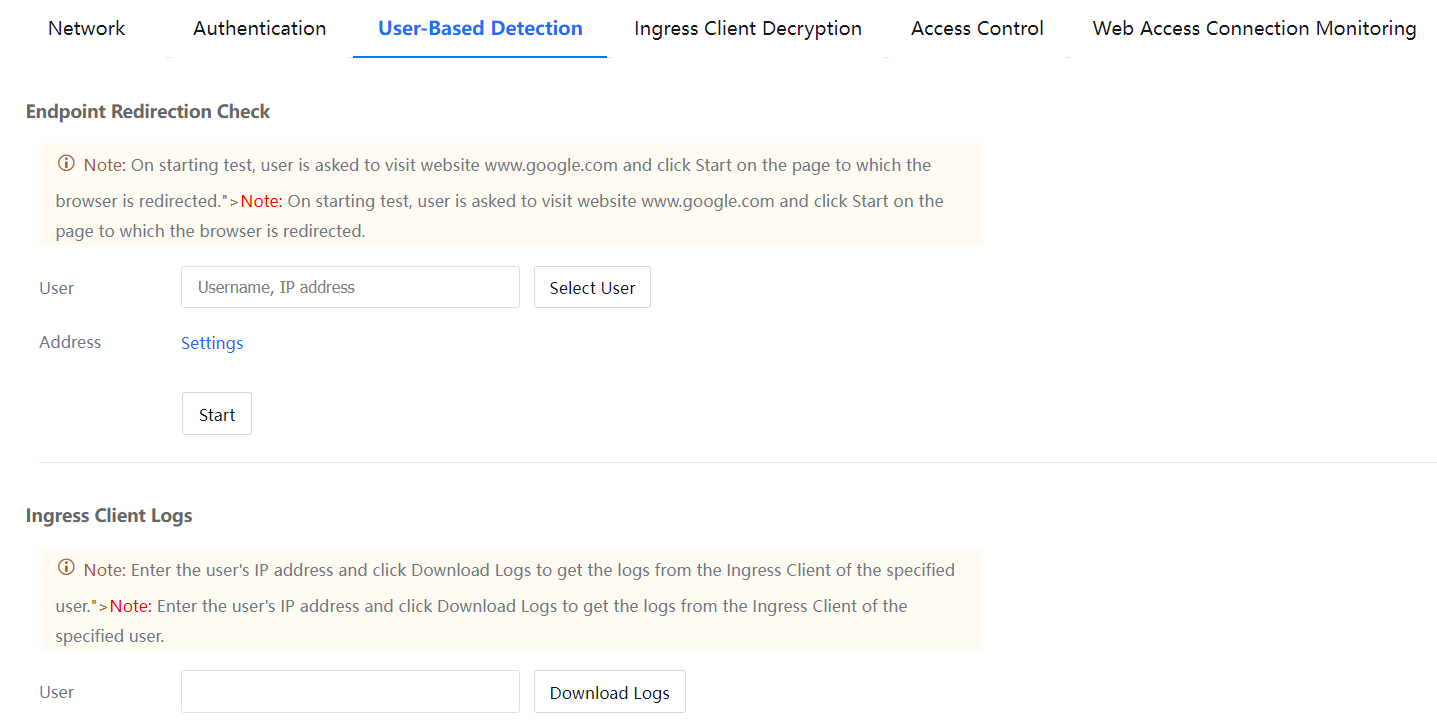
Example: When user A is listed on the slow network list, you can enter the username or IP address in User-Based Detection > User or click Select User and select the user from the following group structure:
If you confirm to submit, click Settings in the Address to configure the address:
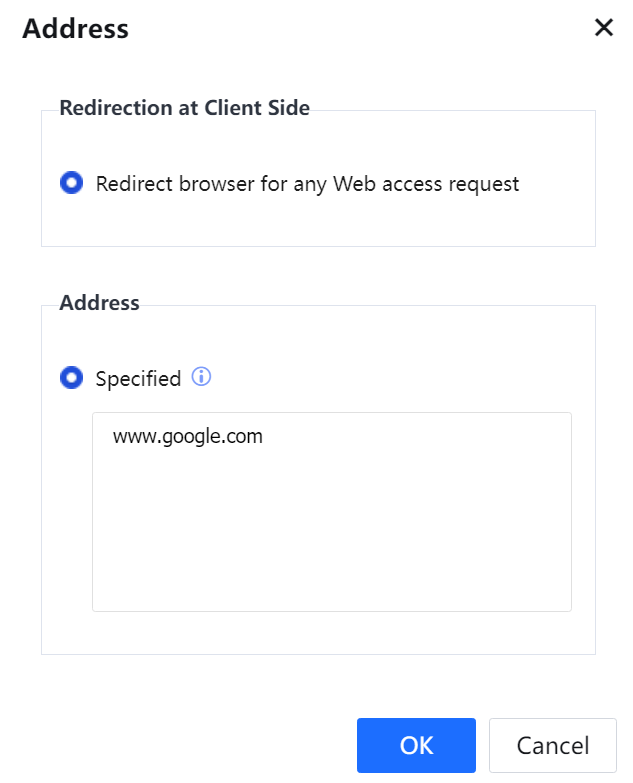
Endpoint page redirection: You can access Baidu to redirect to the test page or redirect all web access to the test page.
Monitored address: Optional use of built-in monitored address library or custom monitored address. If you confirm to submit, click Start.
Take www.google.com as an example:
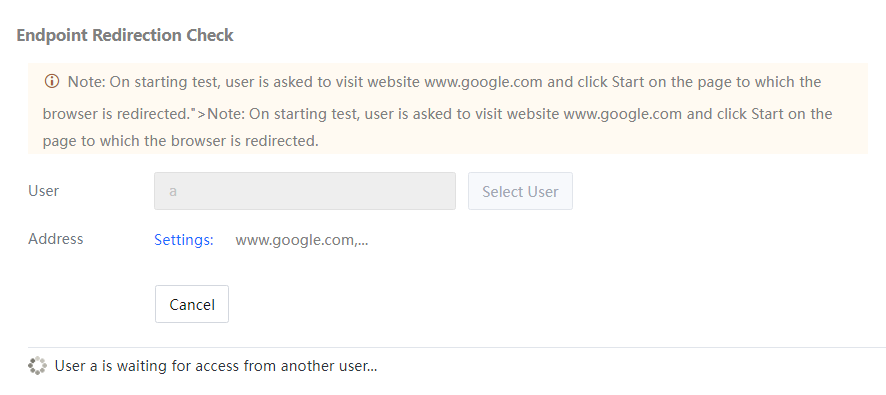
When the user visits www.google.com, they will be redirected to the test page.
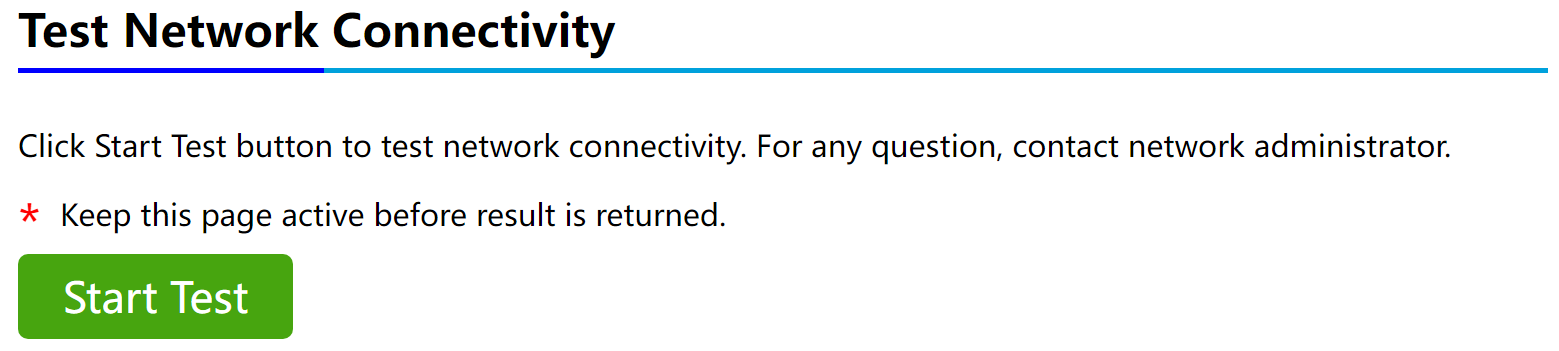
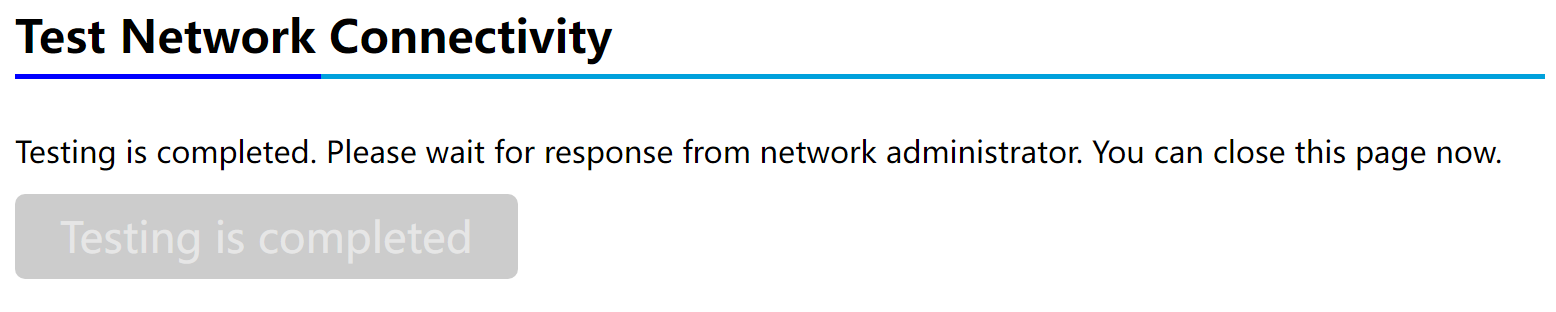
After clicking Start Test, the user will start the detection. There will be a time prompt during the test.
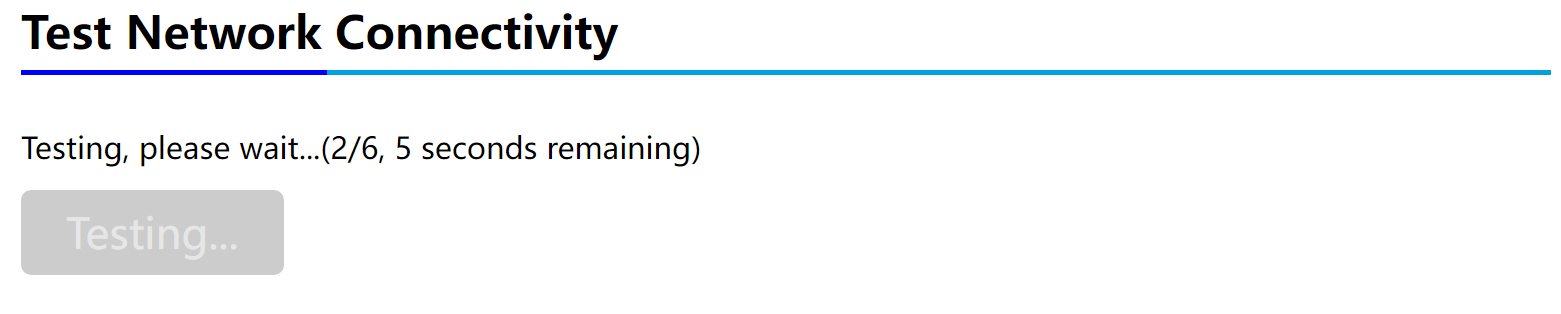
Then the administrator page will indicate detection start:
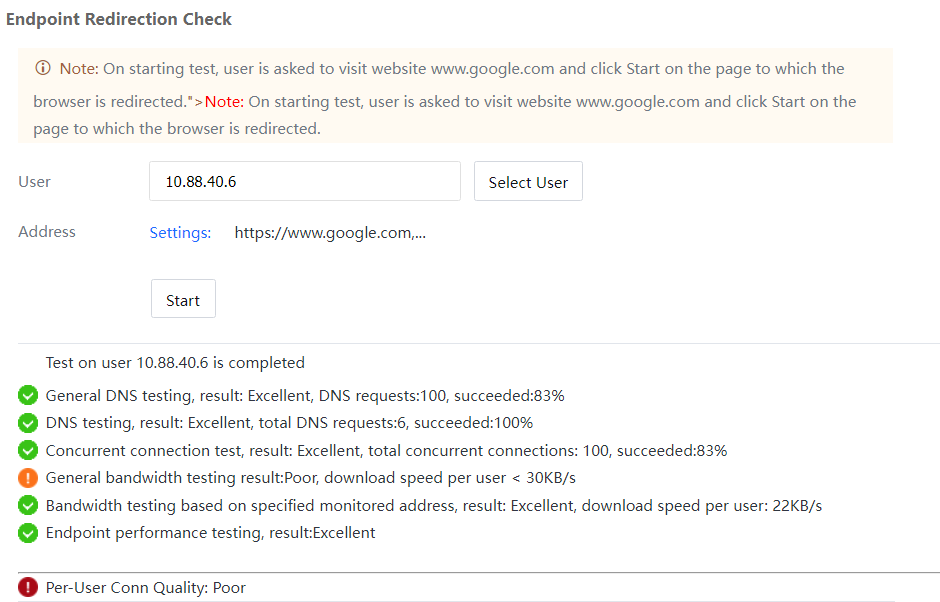
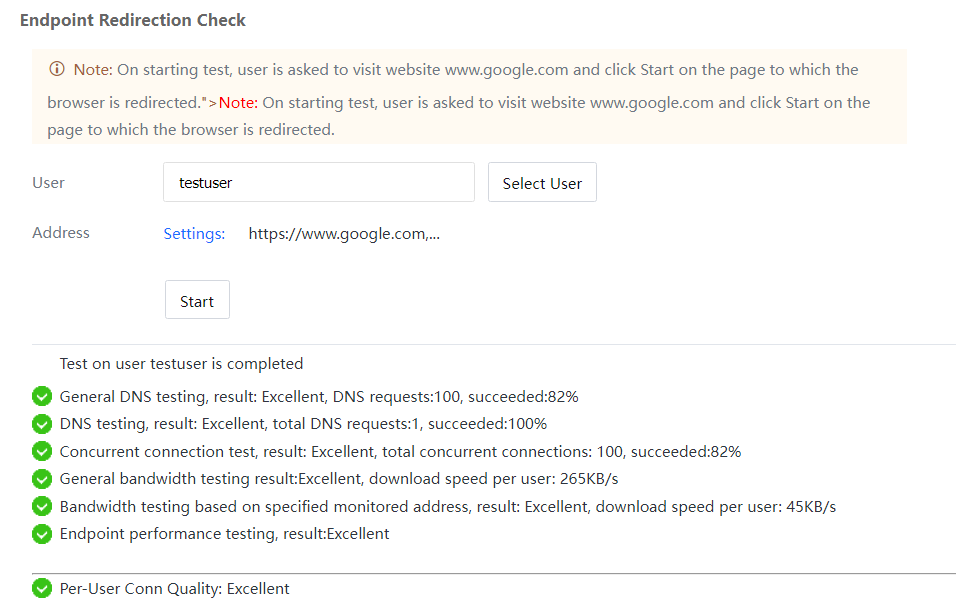
User detection finished:
The detection result will be shown on the administrator page.
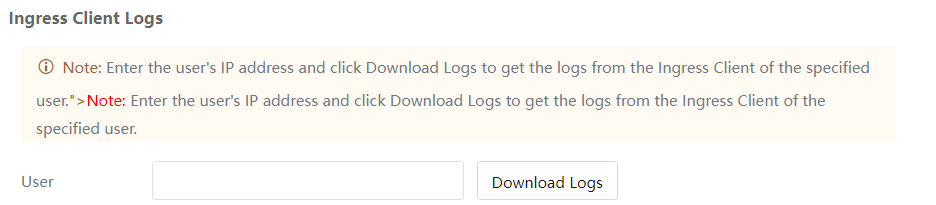
Ingress Client log:
You can download the ingress log from a specific user IP address instead of downloading and searching from a PC.

 {{ $t('index.defaultHeader.chromeBrowserTip') }}