{{ secondMenu.name }}


System Resources are displayed on the Dashboard page, including the graph of Throughput on All WAN Interfaces, Web-Access Connection Monitoring, Top Application by Traffic, SaaS Applications, Top Users by Traffic, Application Bandwidth Distribution, Network Interface, Security Events, Internet Activities, and Regional/Overseas Traffic.
3.3.1.1.1.1 System Resources
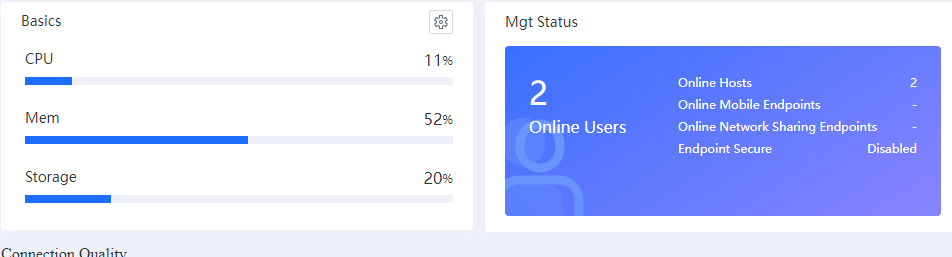
The Basics section displays the overall resource usage of IAG, including the CPU usage, memory usage, and storage usage.
The Mgt Status section displays the overall management status of IAG, including the number of online users, daily connection quality, and daily log summary.
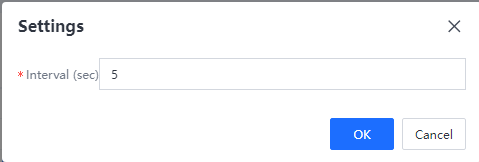
Click![]() to set whether to enable automatic refresh and specify the automatic refresh interval, as shown in the following figure.
to set whether to enable automatic refresh and specify the automatic refresh interval, as shown in the following figure.
Click Internal Report Center to access the homepage of the data center embedded in the device and perform operations such as log query and measurement.
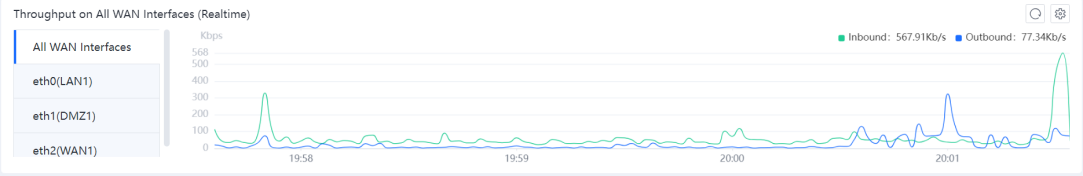
3.3.1.1.1.2 Throughput on ALL WAN Interfaces
The Throughput on ALL WAN Interfaces section displays the real-time conditions of data received and transmitted on interfaces in a curve, as shown in the following figure.
Click ![]() . The following figure is displayed.
. The following figure is displayed.
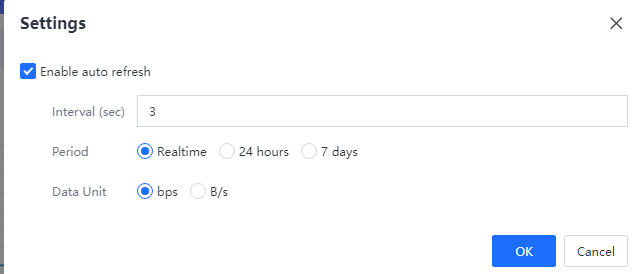
Interval specifies the auto refresh interval. Period specifies the data forwarding conditions of interfaces in the specific time period. Data Unit specifies the traffic unit.
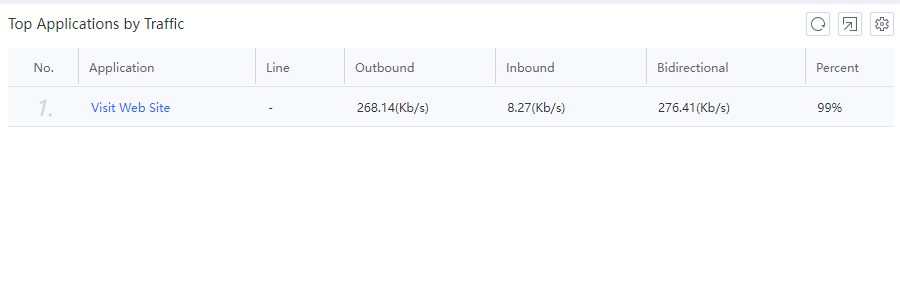
3.3.1.1.1.3 Top Applications by Traffic
The Top Applications by Traffic section displays the top 10 applications by traffic. You can rank the applications by outbound, inbound, or bidirectional traffic.
Click ![]() to set the automatic refresh time. Next, set the username and application type to view details about the application user.
to set the automatic refresh time. Next, set the username and application type to view details about the application user.
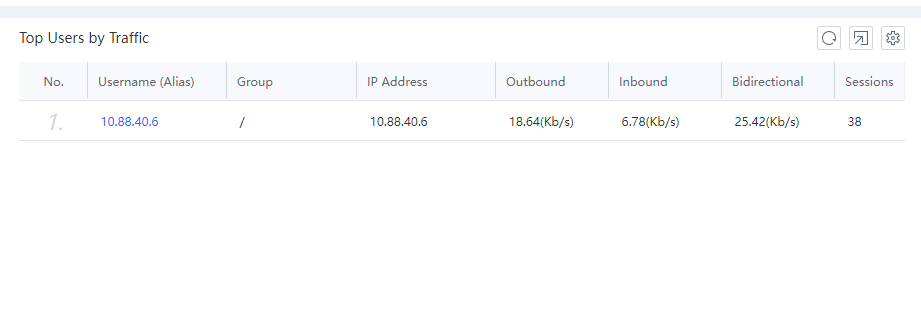
3.3.1.1.1.4 Top Users by Traffic
The Top Users by Traffic section displays the top 10 users by traffic. You can rank users by outbound traffic, inbound traffic, or session quantity.
Specifically, click Outbound to rank users by outbound traffic or Inbound to rank users by inbound traffic.
Click ![]() to set the automatic refresh time. Next, set the username to view details about the applications used by the user.
to set the automatic refresh time. Next, set the username to view details about the applications used by the user.
3.3.1.1.1.5 Network Interface
The Network Interface section displays each network interface's status, cable connection, and real-time transmitted and received traffic. See the following figure.
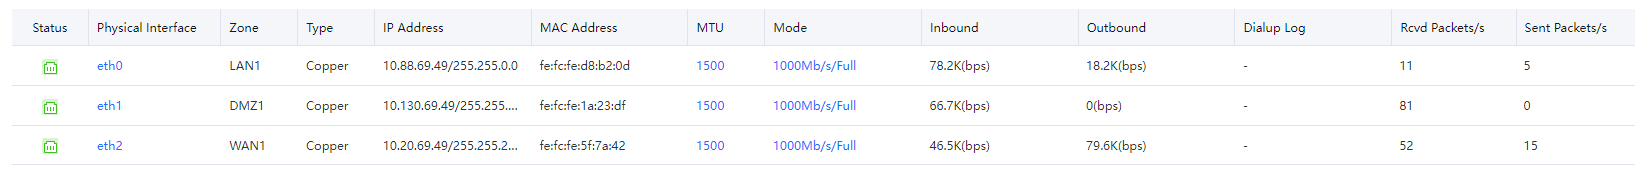
![]() indicates that a network interface is in the connected status, and
indicates that a network interface is in the connected status, and ![]() indicates that a network interface is in the disconnected status. Click
indicates that a network interface is in the disconnected status. Click ![]() to set the automatic refresh interval.
to set the automatic refresh interval.
3.3.1.1.1.6 Security Events
The Security Events section displays the number of times insecure behaviors are detected. See the following figure.
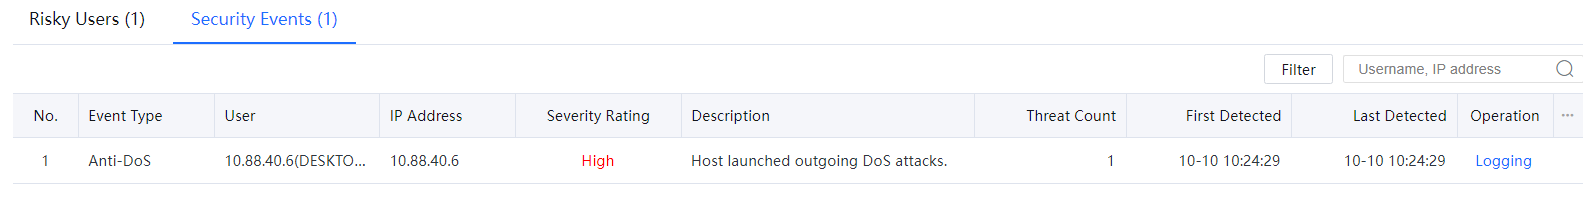
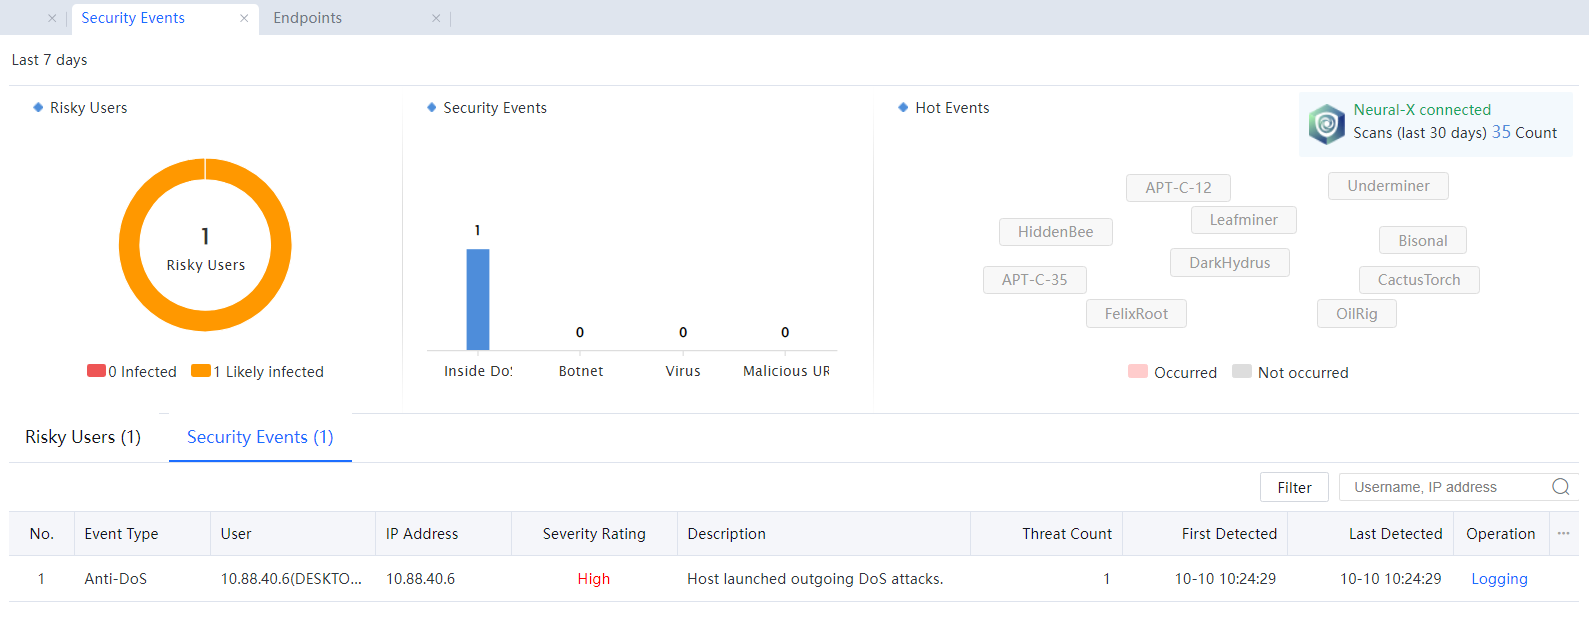
Click ![]() to set the automatic refresh interval.
to set the automatic refresh interval.

 {{ $t('index.defaultHeader.chromeBrowserTip') }}