{{ secondMenu.name }}


]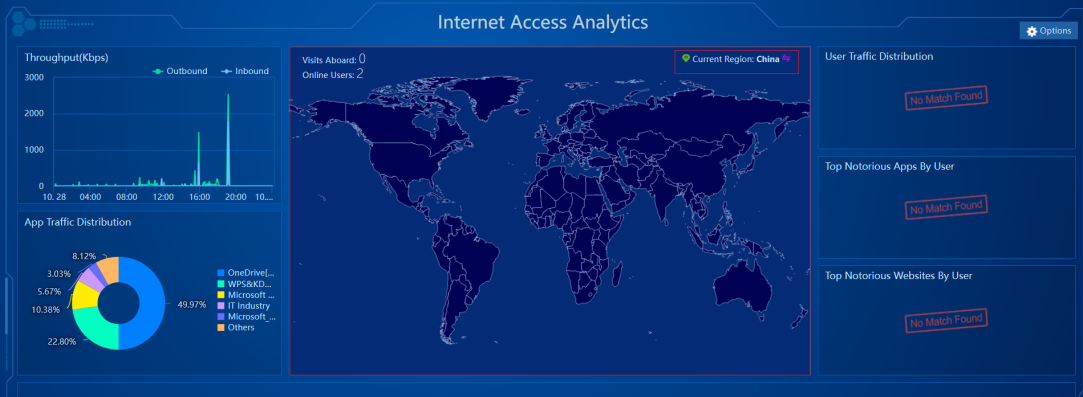
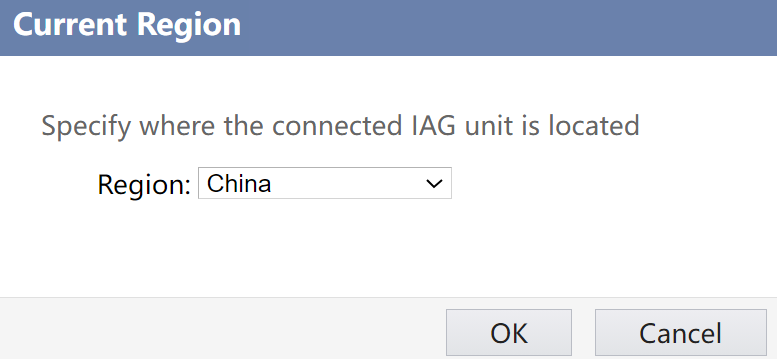
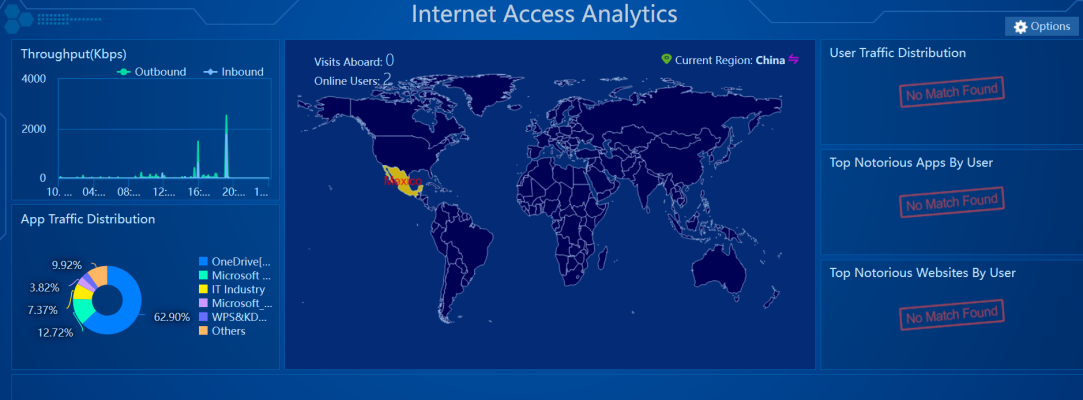
As shown above, click Current Region in the top right corner of the map, set Region to your current region, and click OK to save the settings. Next, the map displays conditions that the current device accesses other network addresses.
Click Options to enter the Internet Access Analytics configuration page, and set contents of three parts, including Contents, Apps & Websites, and Display Options, to define display contents.
Click Restore Defaults to restore the current settings to default settings.
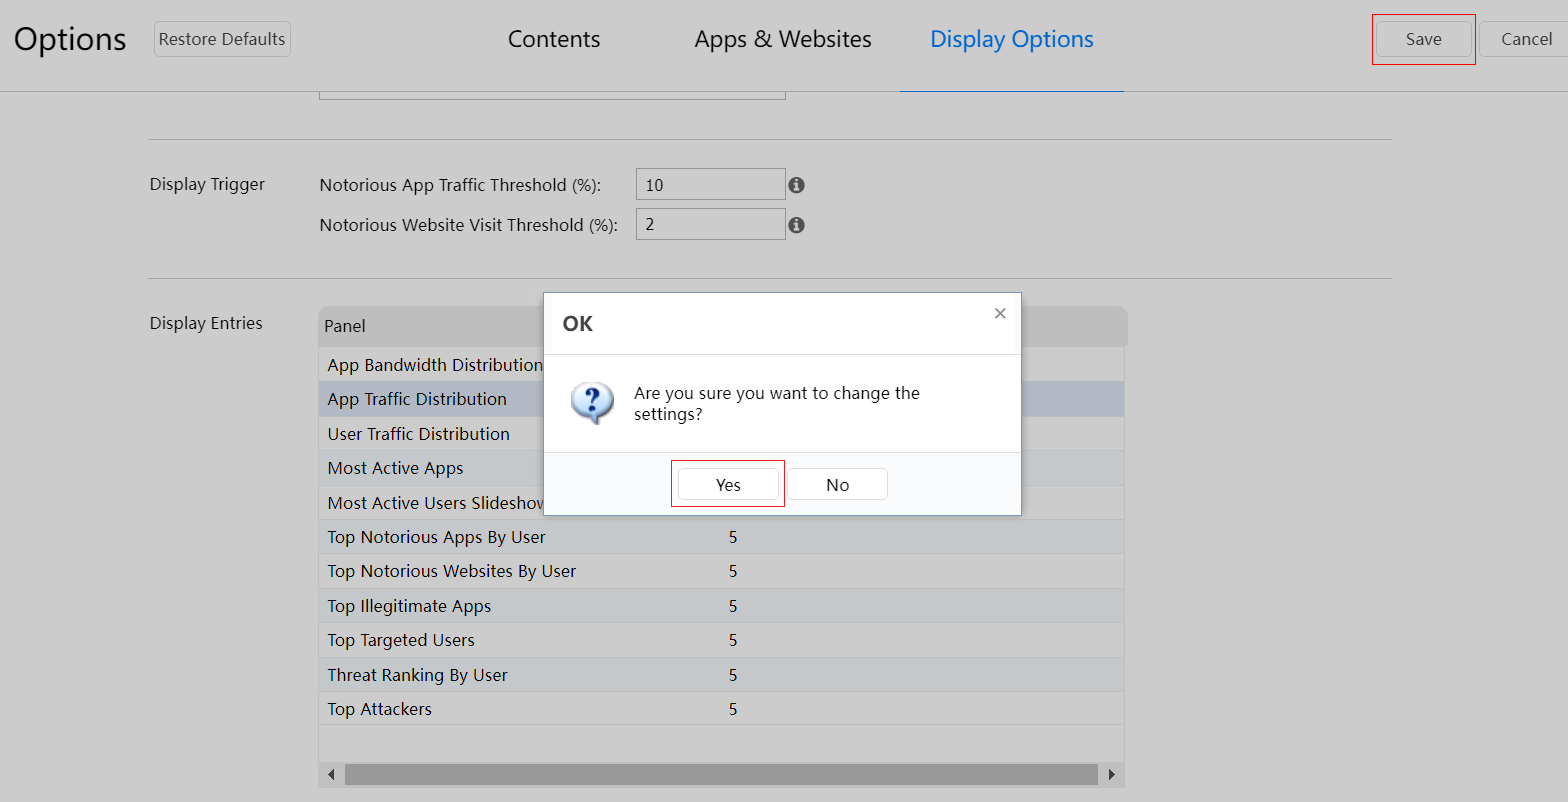
Click Save to save the current settings and take effect.
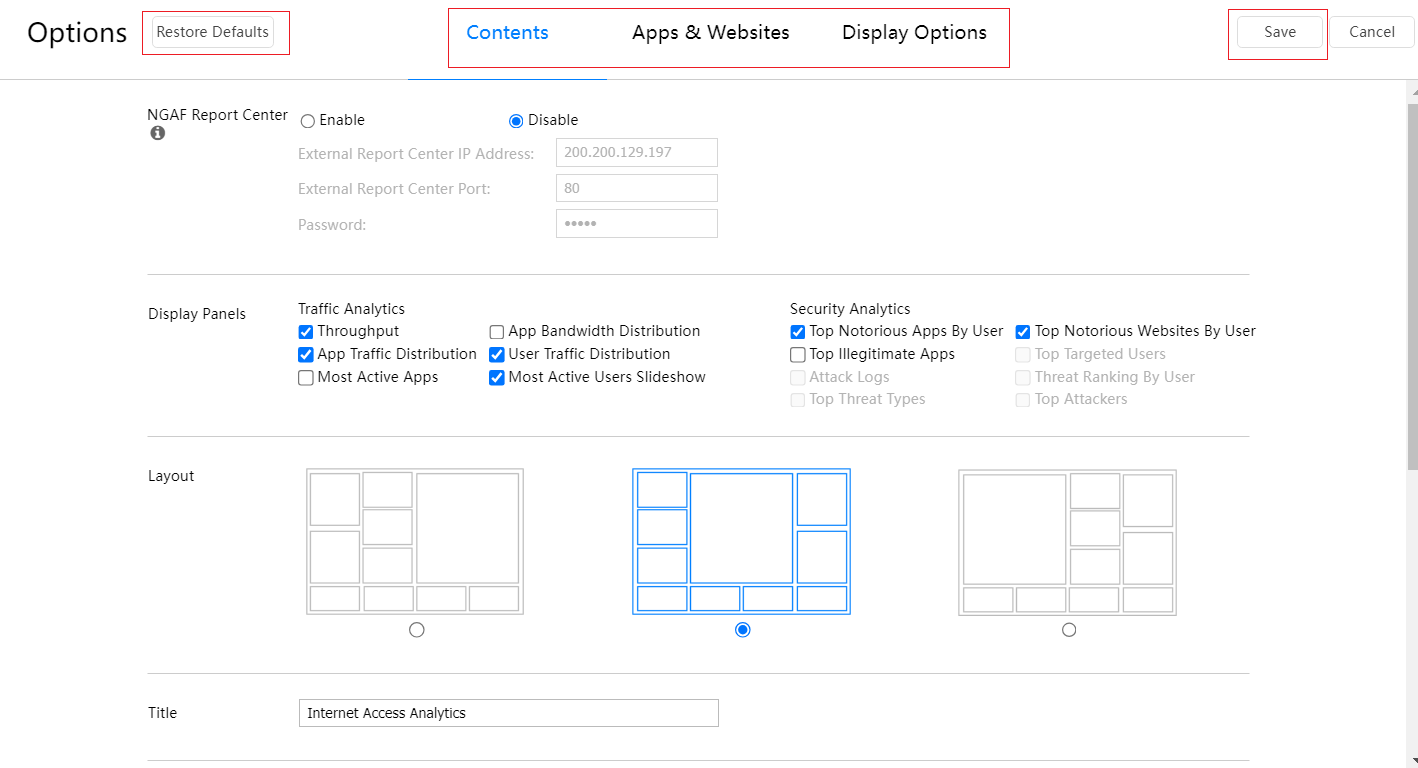
On the Contents page, configure it as follows:
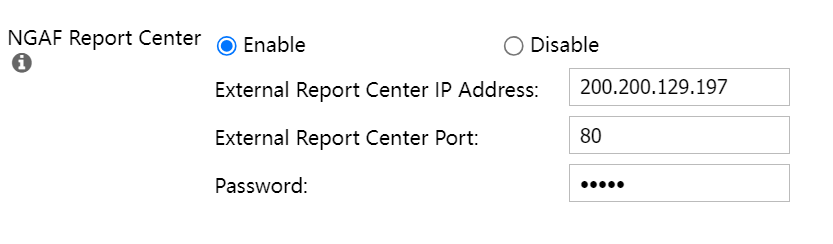
NGAF Report Center: It enables external docking with Sangfor NGAF. After the function is enabled, NGAF-related panels can be displayed on the display screen (your NGAF report center shall support docking).
Enabling method: Click Enable, and fill in the External Report Center IP Address, External Report Center Port, and Password.
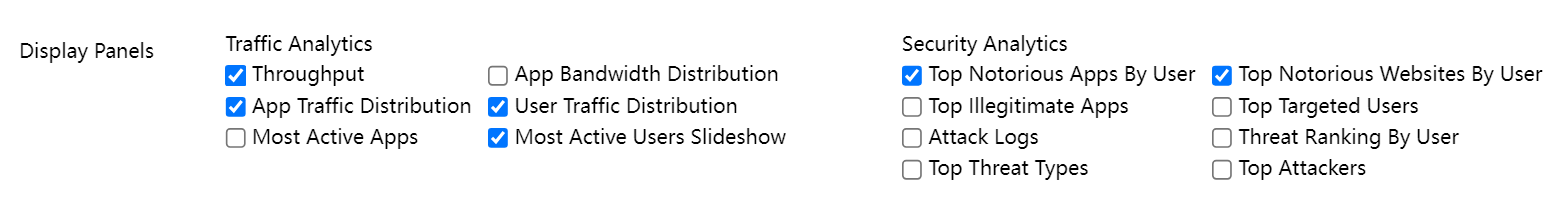
Display Panels: It is divided into Traffic Analytics and Security Analytics. The checked contents will be displayed on the Dashboard page. The more the checked contents, the greater the display density. Selecting a screen with the proper resolution for the display is suggested.
Traffic Analytics: It includes user traffic distribution, most active users slideshow, App traffic distribution, and most active Apps.
Security Analytics: It includes top notorious Apps by the user, top illegitimate Apps, attack logs, top threat types, top notorious websites by the user, top targeted users, threat ranking by the user, and top attackers.
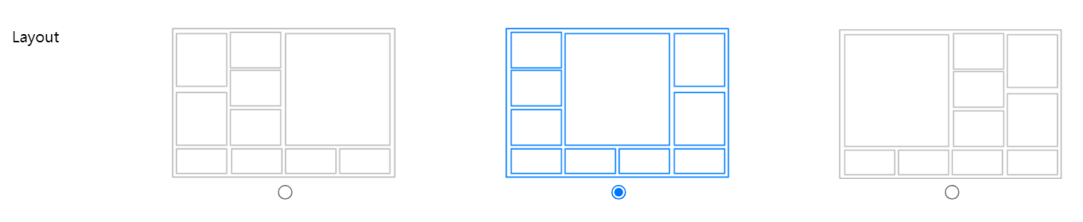
Layout: The overall layout model is adjusted per demands, including left-aligned, center-aligned, and right-aligned.
Title: As shown in the following figure, define the headline of display contents on the Dashboard page.
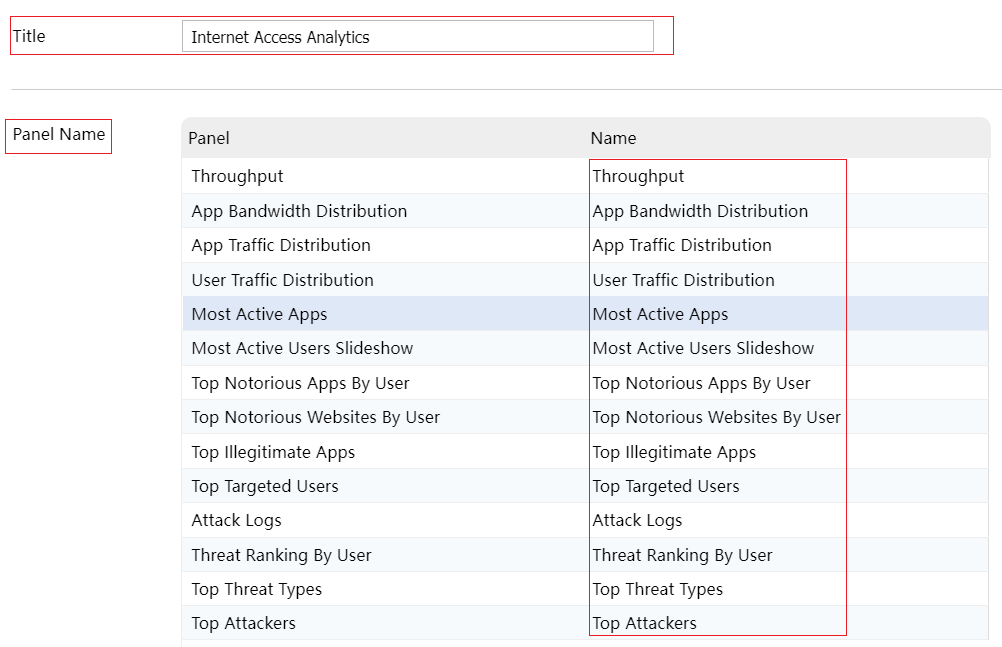
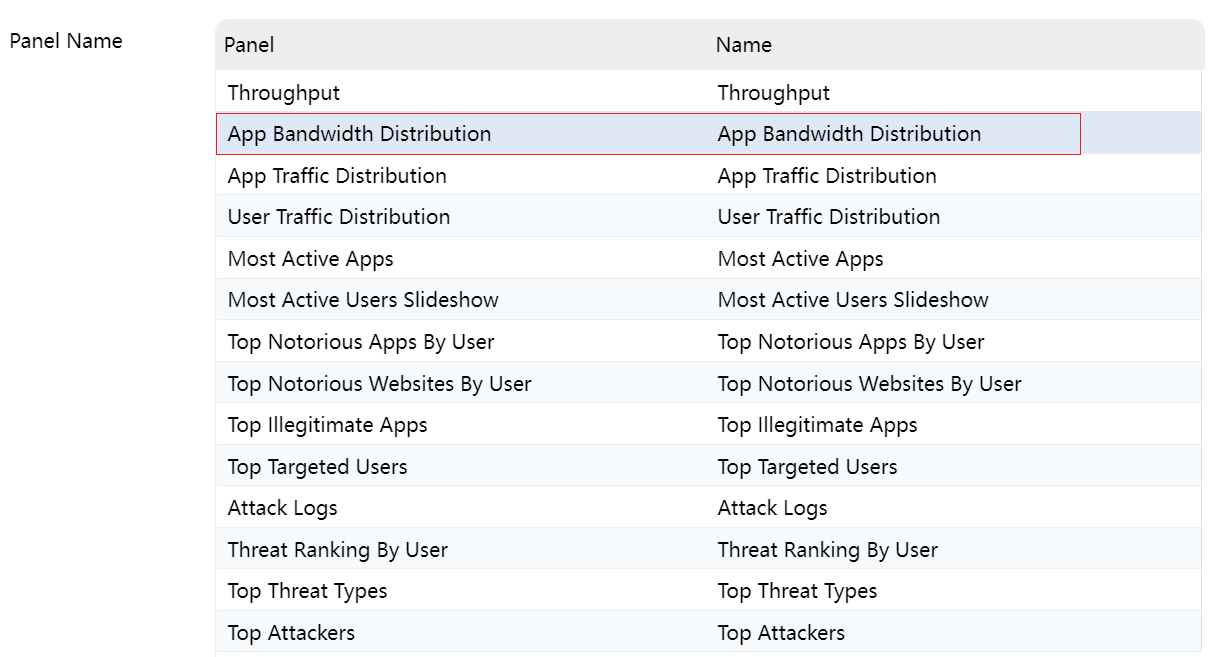
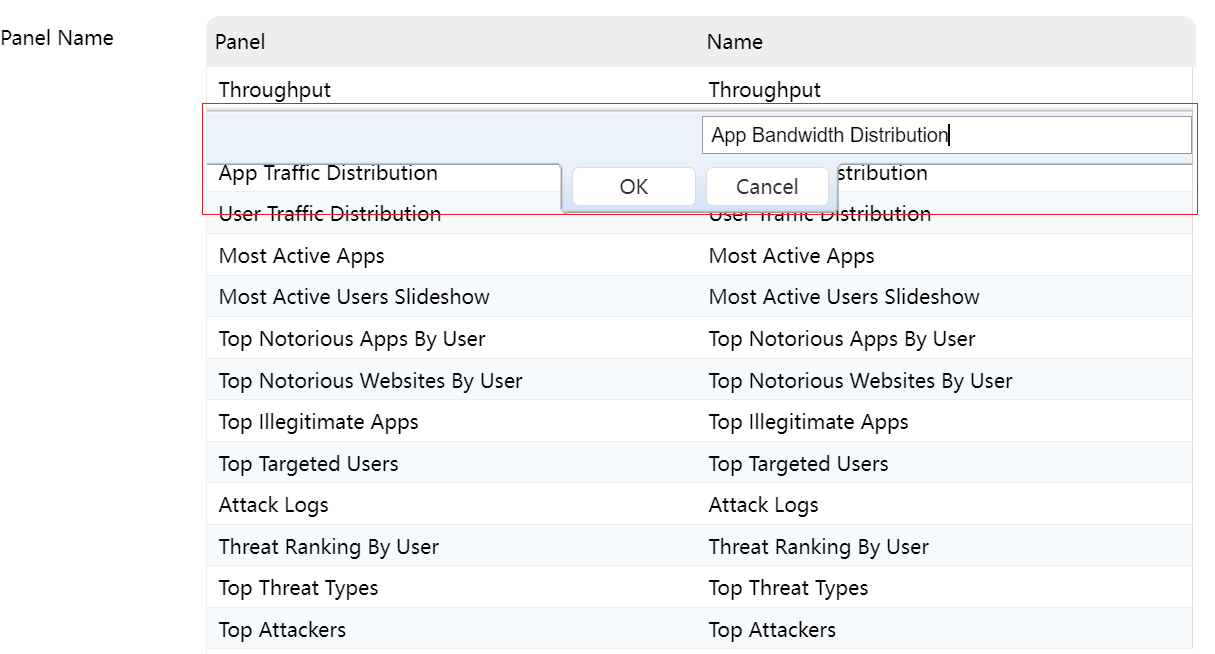
Panel Name: As shown above, define the names of all panels displayed on the Dashboard page. As shown in the following figure, the Panel displays the name of each panel, and double-click the row where a panel needs to be modified to edit the panel name displayed underneath Name; after changing, click OK to save the settings.
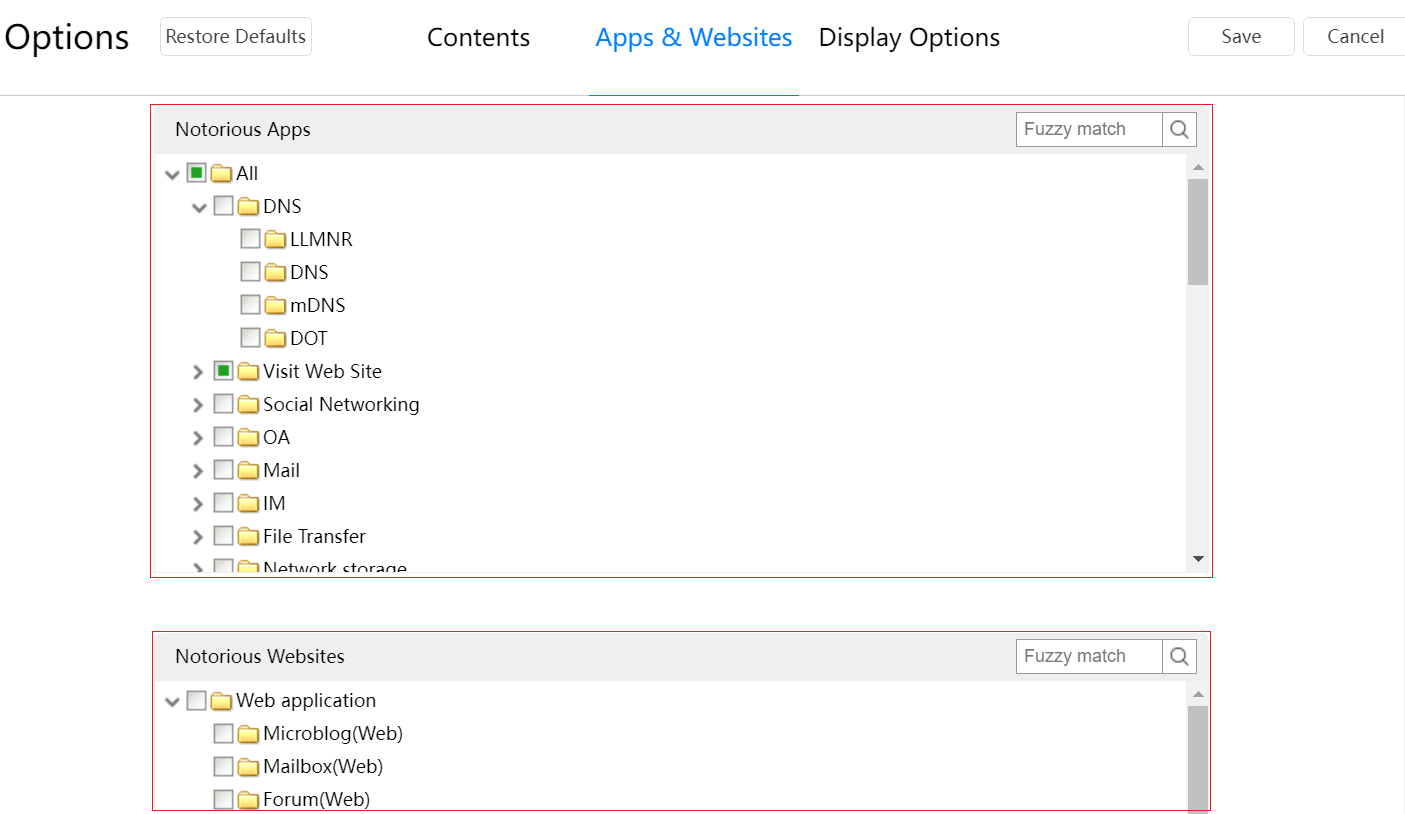
As shown above, select Notorious Apps and Notorious Websites.
Check a specific notorious app category to be displayed in Notorious Apps, and check a notorious website category to be displayed in Notorious Websites. Both options support fuzzy queries.
As shown above, set the display options.
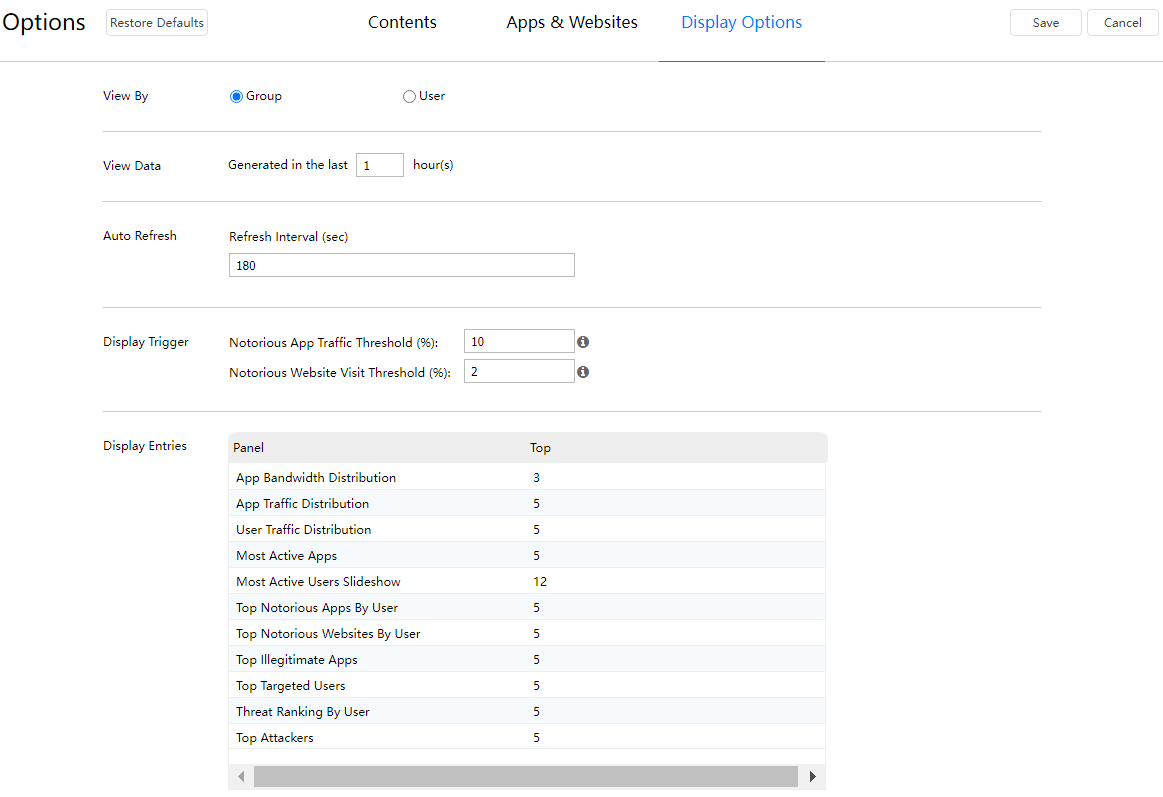
View By: Select group or user as a query object.
View Data: Define the data of several recent hours in that day for querying.
Auto Refresh: Define the time interval for data refreshing in seconds (180 seconds by default, 60 seconds at minimum, and 3,600 seconds at maximum).
Display Trigger: Define the percentage of notorious App traffic threshold, i.e., the unit status is displayed as abnormal when the proportion of notorious App traffic exceeds the defined threshold. Define the percentage of notorious website visit threshold, i.e., the unit status is displayed as abnormal when the number of notorious website visits exceeds the defined threshold.
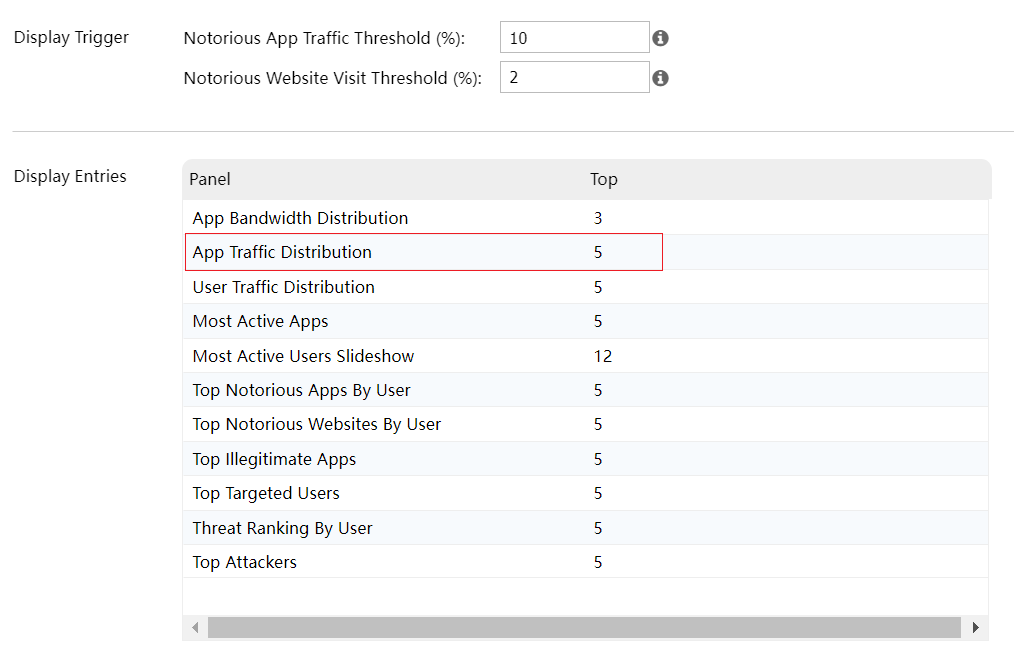
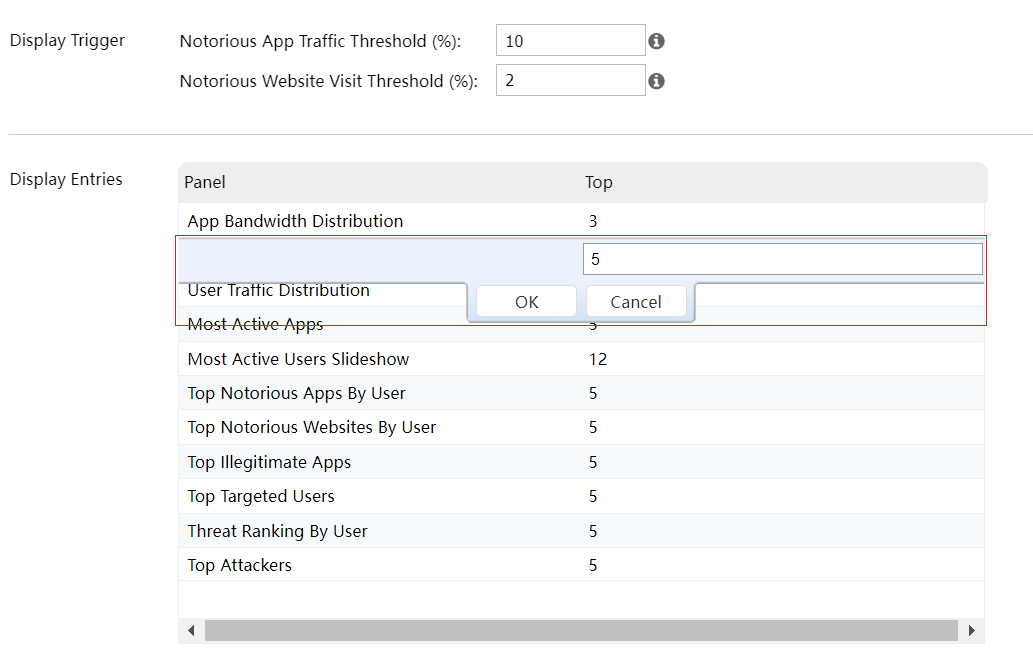
Display Entries: As shown below, define the top number of display objects in each panel on the Dashboard page. Panel: Define the name of each panel, and double-click the row where a panel to be modified is to edit the Top; after changing, click OK to save the settings.
![]()
Affected by the size and aesthetics of the display box, please adjust the number of objects to be displayed as per actual situations.
Finally, click Save and then Yes to save the settings.
Since data acquisition of Internet Access Analytics is implemented on IAG devices in real time, please wait for a while after all the settings take effect, and you will see the analysis result.

 {{ $t('index.defaultHeader.chromeBrowserTip') }}